
Following the massive breakout seen on the higher timeframes, our XAU/USD Intraday Analysis reveals a surge in short-term buying pressure. The 1-hour chart shows gold carving out a steep ascending path, leaving previous local resistance levels far behind.
Before diving into the hourly details, make sure to check our Gold Price Analysis XAU/USD: Massive Breakout Above $5,130 for the broader market outlook.
1-Hour Technical Momentum: The Vertical Climb
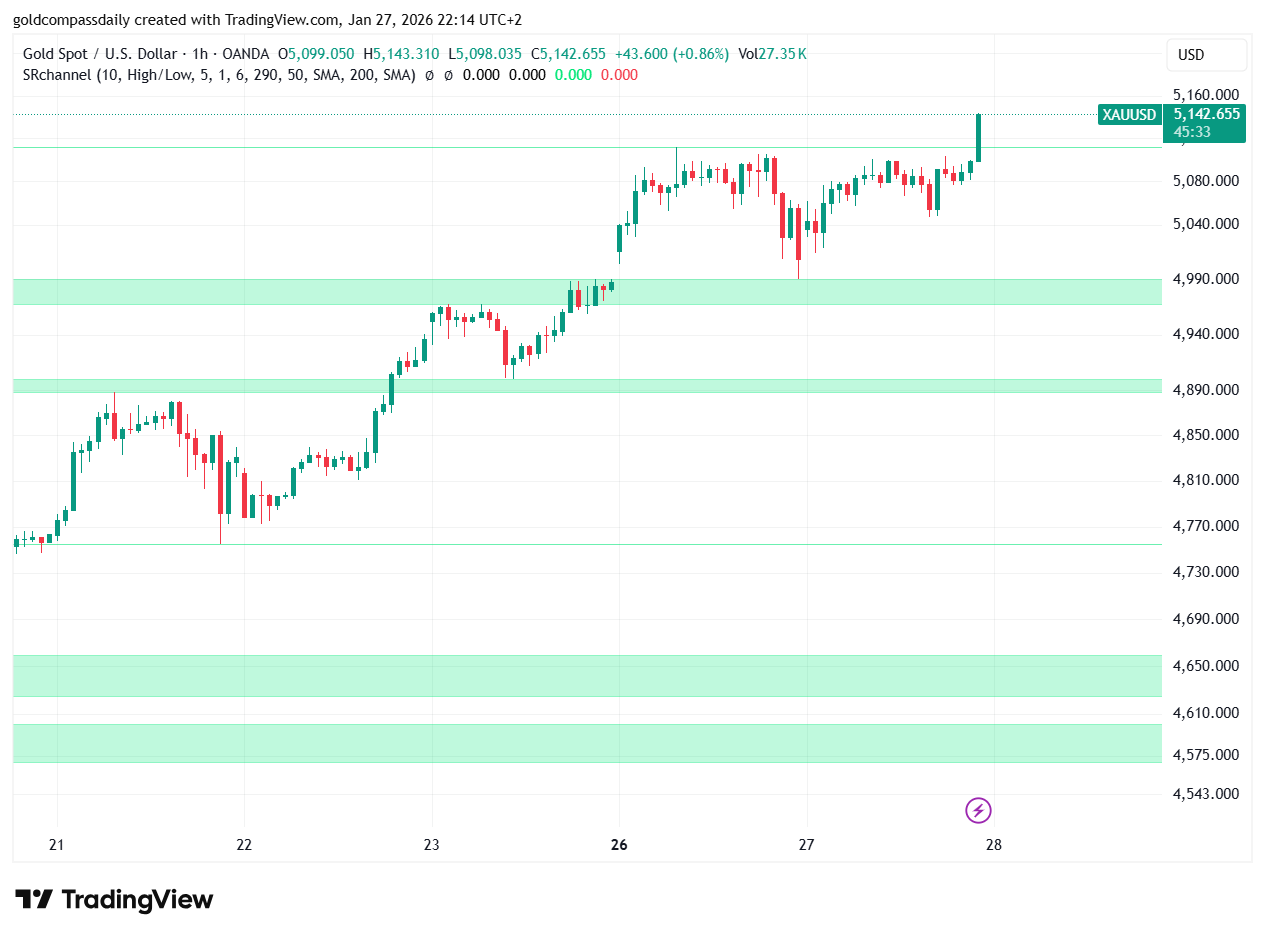
The 1-hour timeframe provides a clear view of the current market “melt-up.” Gold (XAU/USD) has maintained a series of higher lows throughout the day, culminating in a vertical spike toward $5,142. This move highlights extreme bullish confidence as we head into the Asian session.
Current observations from our XAU/USD Intraday Analysis:
- Volume Spike: The most recent 1H candles show a significant increase in volume, confirming that this is not just a volatility spike but a sustained trend.
- Moving Average Alignment: Price remains significantly stretched above short-term moving averages, signaling a powerful momentum-driven phase.
- Resistance to Support: The previous hourly peak near $5,110 has now been firmly established as a secondary support floor.
Intraday Targets and Support Zones
As per the current XAU/USD Intraday Analysis, the bulls are clearly eyeing the $5,150 psychological barrier. On the 1-hour chart, we see very little structural resistance between the current price and that target.
Immediate Levels to Watch:
- Intraday Resistance: $5,145 — $5,155
- Immediate 1H Support: $5,128 (Recent breakout point)
- Deep Support Zone: $5,080 — $5,100 (Major accumulation area)
Trading Strategy: Buying the Dips
The hourly trend is exceptionally strong. From a technical standpoint in this XAU/USD Intraday Analysis, any minor pullbacks toward the $5,130 area are likely to be met with fresh buying interest. Traders should be cautious of a temporary RSI cooling period, but the overall bias remains firmly to the upside.
Conclusion: The 1-hour chart is a testament to the current “Gold Rush.” With the price holding steady above $5,140, the momentum suggests that new record highs are just a matter of hours away. Stay sharp and monitor the $5,130 support closely.