
The lower timeframes are currently offering a masterclass in market psychology. Following a sharp liquidity hunt that drove XAU/USD down to the $5,120 handle, we are now witnessing a textbook Gold Price Recovery. On the 5-minute chart, the price action has shifted from a vertical sell-off to a structured ascending move, reclaiming key short-term moving averages and signaling that the bulls are fighting back with significant conviction.
The Mechanics of the V-Shape Bounce
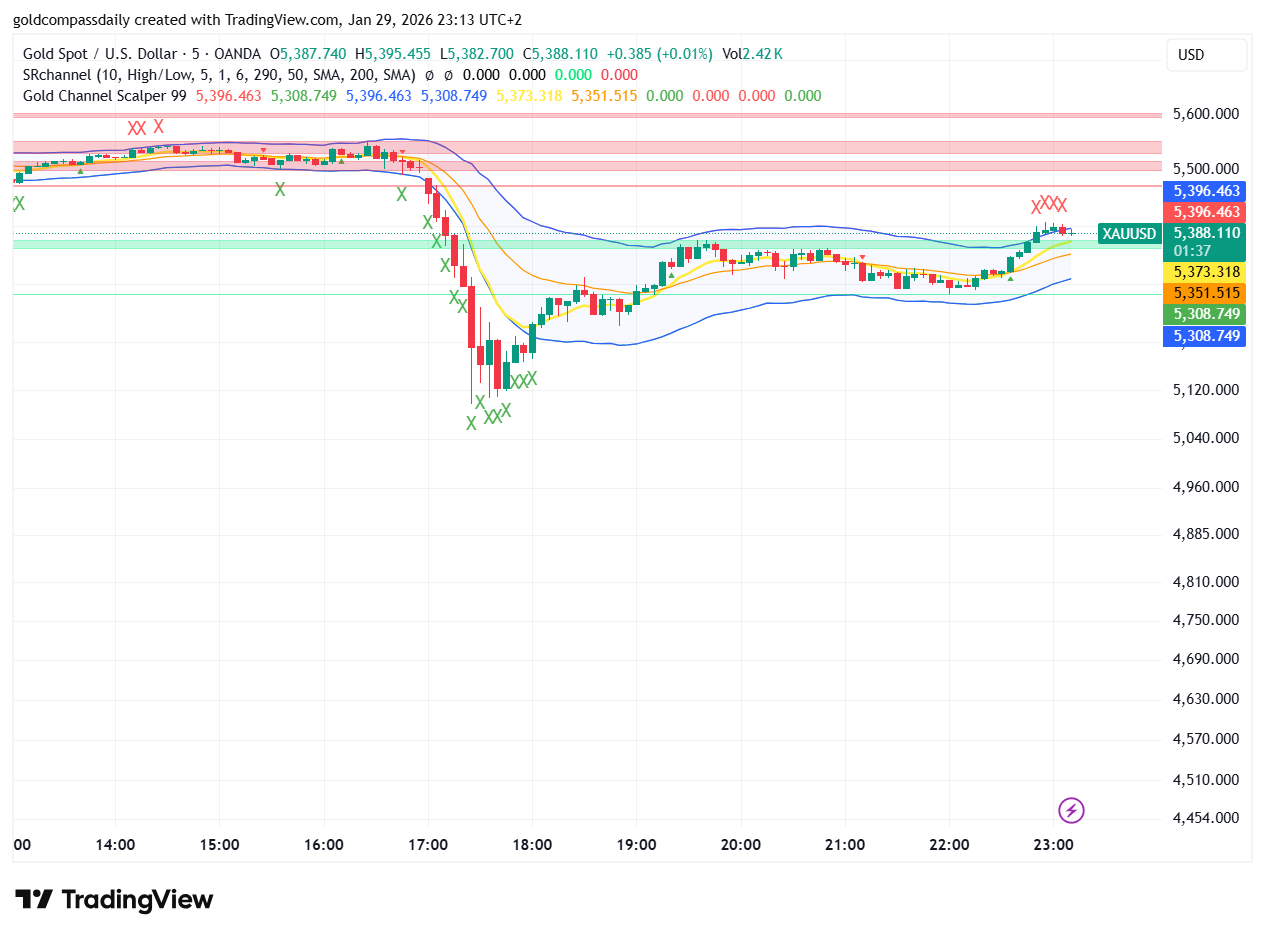
The 5-minute timeframe highlights a classic exhaustion phase where the sellers simply ran out of steam. As indicated by the cluster of green ‘X’ marks at the absolute bottom of the move, the oversold conditions reached an extreme, triggering a massive wave of short-covering. This Gold Price Recovery was not slow; it was an explosive reaction to a deep discount in price, showing that institutional demand remains robust even during high-volatility sessions.
Currently, the Gold Channel Scalper 99 shows the price breaking out of the lower volatility band and stabilizing in the upper half of the channel. This shift is a crucial first step for any sustained Gold Price Recovery, as it indicates that buyers are now willing to pay higher prices to secure their positions before the next daily open.
Key Scalping Levels and Technical Targets
For traders operating on the 5-minute chart, precision is everything. To confirm the continuation of this Gold Price Recovery, we must monitor the following technical levels:
- Immediate Resistance ($5,396): The previous breakdown point that now acts as a magnetic target for the current bounce.
- Consolidation Support ($5,308): A successful retest of this level would confirm a “higher low” structure, providing a safer entry for late buyers.
- The ‘Fair Value’ Zone ($5,350 – $5,370): This is where the price is currently gravitating, seeking a temporary equilibrium after the morning’s chaos.
Interpreting the 5-Minute Indicator Signals
The SRChannel indicator on this timeframe provides a very granular view of the Gold Price Recovery. We can see a series of small, constructive candles building a base. The red ‘X’ marks that previously dominated the top of the chart have been replaced by green signals, suggesting that the path of least resistance has temporarily flipped to the upside.
Volume analysis during this 5-minute rally shows a healthy participation rate. Unlike a “fake-out” move, this recovery is accompanied by steady buying pressure, as seen in the increasing candle bodies. If XAU/USD can clear the $5,400 psychological barrier on this timeframe, the Gold Price Recovery could easily extend toward the 1-hour and 4-hour resistance zones we analyzed earlier.
Risk Management in High-Volatility Scenarios
While the 5-minute Gold Price Recovery looks promising, intraday traders must remain vigilant. High-frequency trading (HFT) algorithms often create “bull traps” during these V-shape recoveries. A sharp reversal below the $5,280 mark would invalidate the current bullish thesis and suggest that the market is heading for a double-bottom retest.
Therefore, using tight trailing stops and paying close attention to the 50-period SMA (Simple Moving Average) is vital. A break back below the moving average would be the first sign that the Gold Price Recovery is losing its momentum. For now, the trend is your friend, but in the 5-minute world, friends can change their minds very quickly.
Conclusion
The aggressive Gold Price Recovery seen on the 5-minute chart is a testament to the underlying strength of the gold market in early 2026. Despite the massive liquidation event earlier in the day, the market’s ability to bounce back nearly $200 from the lows is a major bullish signal. Whether this is a permanent bottom or just a relief rally remains to be seen, but for the immediate term, the bulls have regained the steering wheel. Watch the $5,396 resistance closely – a breakout there will confirm that the recovery has legs.