
In the world of high-frequency trading, the 5-minute chart offers the most granular look at market psychology. Following a period of intense selling pressure, the current Gold Price Recovery is a testament to the underlying demand for XAU/USD. Traders who specialize in scalping are now focusing on the rapid shifts in momentum that suggest a short-term bottom has been established, allowing for high-probability entries with tight risk management.
Identifying the V-Shape Bounce and Momentum Shift
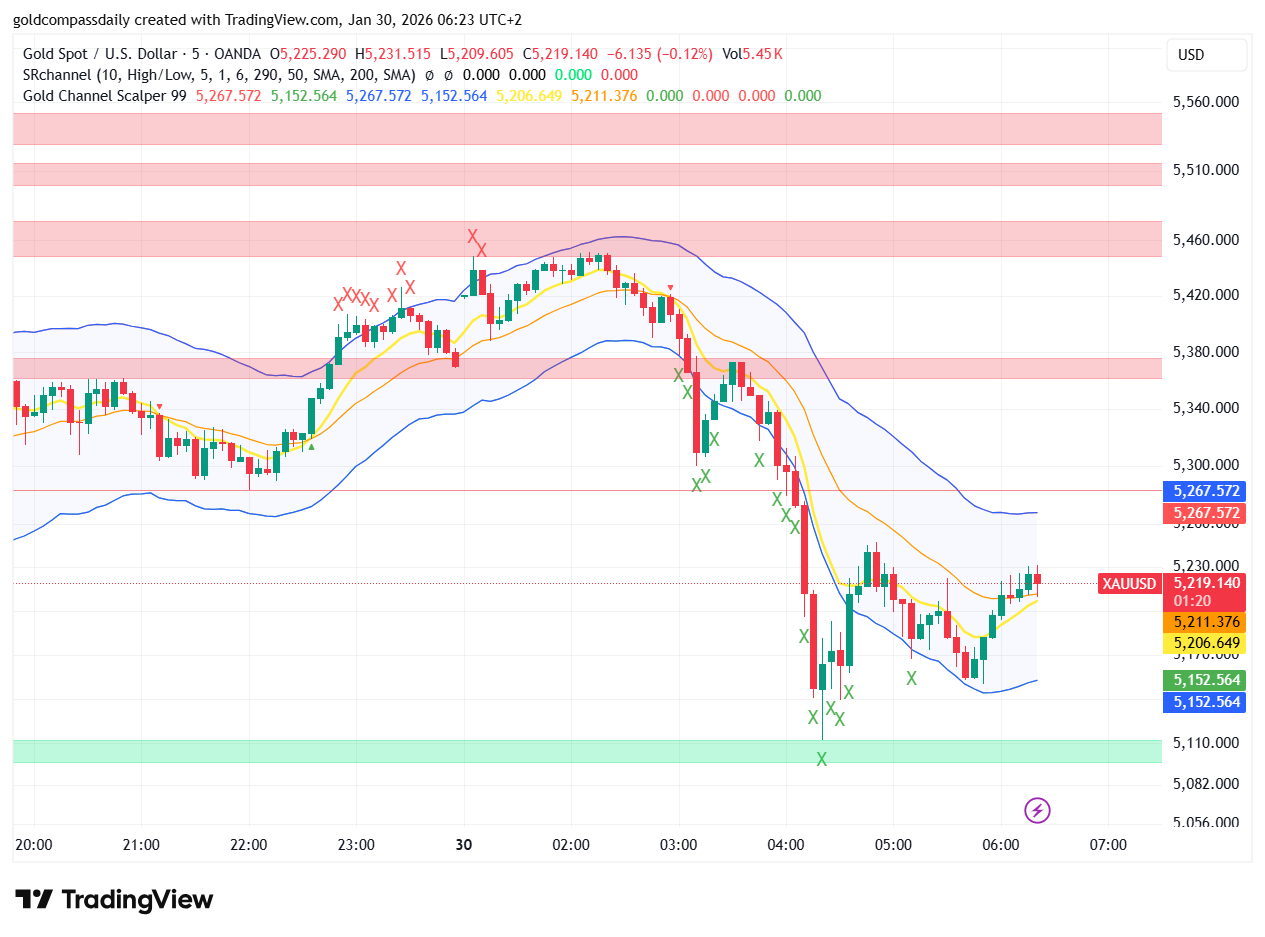
The 5-minute timeframe is ideal for spotting the initial signs of a Gold Price Recovery. As seen in the recent price action, gold experienced a sharp decline that was quickly met with aggressive buying at the $5,300 psychological support. This “V-shape” bounce is often driven by a combination of short-covering and new long positions from institutional players looking for a discount. When the price reclaims the 9-period Exponential Moving Average (EMA) on this timeframe, it serves as the first technical confirmation that the recovery has legs.
Our Gold Channel Scalper indicator highlights this shift by showing the price breaking out of the lower oversold bands. This move is crucial for a sustained Gold Price Recovery, as it signals that the immediate bearish exhaustion is over and a new bullish structure of higher highs and higher lows is beginning to form on the intraday level.
Strategic Support and Scalp Targets
To navigate a Gold Price Recovery effectively, a trader must be precise with their levels. The 5-minute chart reveals several critical zones that will dictate the price trajectory for the next few hours:
- Immediate Support ($5,308): The most recent swing low that must hold to keep the bullish momentum alive.
- Primary Resistance ($5,396): A breakthrough here would confirm the end of the localized correction and open the path toward $5,450.
- Consolidation Pivot ($5,350): The “fair value” zone where the market is currently seeking equilibrium during this recovery phase.
The Importance of Volume and Indicator Confirmation
A true Gold Price Recovery is always accompanied by an expansion in trading volume. On the 5-minute chart, watch for long-wicked candles (pin bars) followed by high-volume green candles. The ‘X’ signals on our TradingView setup have moved from red to green at the $5,280 level, providing a clear visual cue for the reversal. When these signals appear in sync with an RSI (Relative Strength Index) rising out of oversold territory (below 30), the probability of a successful scalp increases significantly.
It is also important to observe the “slope” of the recovery. A steady, 45-degree ascent is usually more sustainable than a vertical spike, which often leads to a “bull trap.” By monitoring these micro-movements, traders can distinguish between a temporary relief rally and a genuine Gold Price Recovery that could potentially reverse the trend on higher timeframes like the 1-hour or 4-hour charts.
Risk Management for 5-Minute Traders
Scalping during a Gold Price Recovery requires discipline. Because volatility is high, stop-losses should be placed just below the most recent 5-minute support zone to avoid being caught in a liquidity hunt. In early 2026, we are seeing increased “noise” during the London and New York overlaps, making it vital to exit trades quickly once the initial scalp targets are reached. Remember, on the 5-minute chart, the trend can flip in a heartbeat.
Conclusion
The ongoing Gold Price Recovery showcased on the 5-minute chart provides a roadmap for agile traders. While the broader market may still be digesting the recent correction, the micro-trend is clearly favoring the bulls for the time being. By focusing on V-shape reversals, reclaiming key moving averages, and watching for volume confirmation, you can capitalize on these quick moves. As long as XAU/USD stays above the $5,300 handle, the Gold Price Recovery remains the dominant intraday theme. Stay alert and keep your targets realistic.