
Gold Intraday Forecast 2026: Bulls Reclaim Control After Decadel-High Volatility
The gold market on February 3, 2026, is witnessing one of the most significant intraday reversals in recent history. After gold prices plunged roughly 21% from their late-January peak of $5,608, the 5-minute (M5) chart is now showing a classic “V-shape” recovery pattern. This Gold Intraday Forecast 2026 breaks down the rapid price action that has seen gold surge back toward the $4,930 mark in just a few trading hours.
The primary catalyst for this shift is a blend of geopolitical stability and technical bargain hunting. US President Trump’s announcement of a trade deal with India, which slashes tariffs to 18%, has injected broad optimism into the markets. While the nomination of Kevin Warsh as Fed Chair initially sparked a “hawkish” sell-off, investors are now rotating back into gold as a strategic hedge against currency debasement.
M5 Technical Outlook: Scalping the Recovery
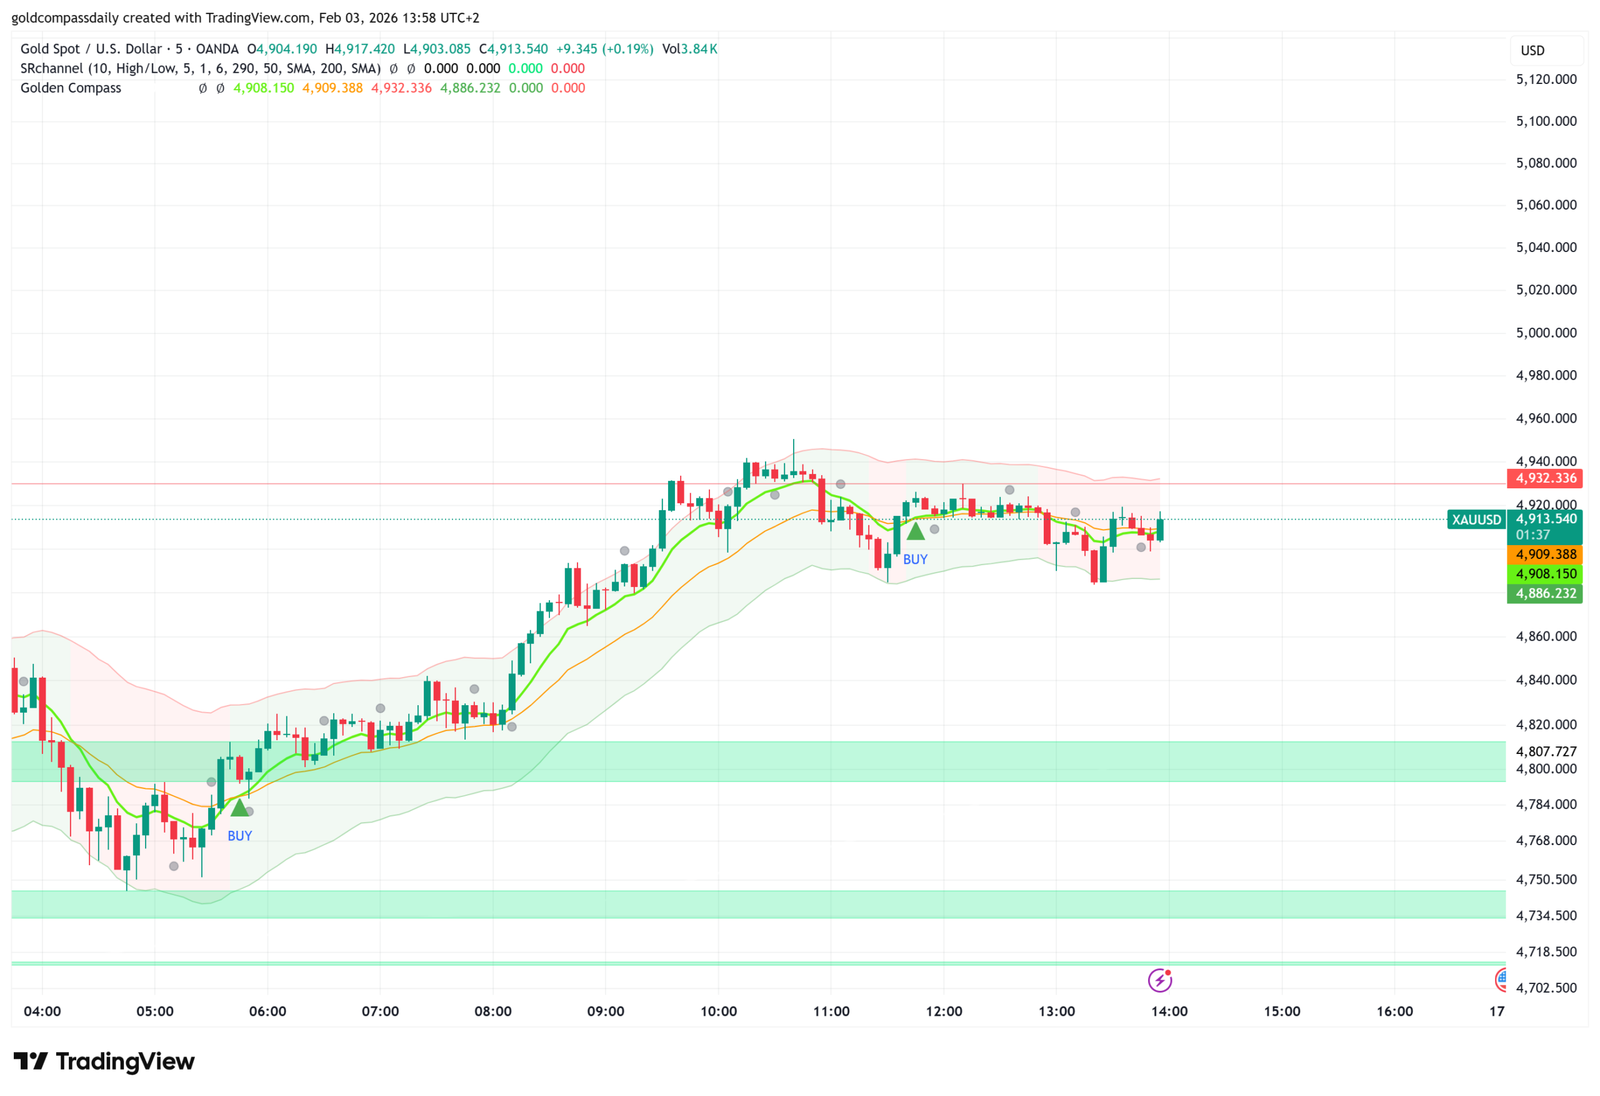
For intraday traders, the M5 chart is providing high-velocity setups. The price action has successfully breached the 50-period and 200-period Exponential Moving Averages (EMAs) on the 5-minute scale, turning old resistance into new support.
Key intraday levels to monitor based on today’s Gold Intraday Forecast 2026:
- Resistance 1 ($4,937): The current intraday ceiling. A breakout above this level on heavy volume targets the psychological $5,000 barrier.
- Pivot Support ($4,821): Formerly a major hurdle, this zone now acts as the primary floor for the afternoon session.
- Stop-Loss Level ($4,789): For active long positions, a dip below this level suggests the recovery is losing steam and a retest of the $4,700 lows is likely.
Momentum Indicators: RSI and MACD Divergence
Short-term momentum is currently favoring the bulls. The 5-minute RSI is hovering near 62, indicating strong buying pressure without yet entering extreme “overbought” territory. Interestingly, the MACD (Moving Average Convergence Divergence) is rising steadily in positive territory, confirming that the current “Rising Three Methods” candlestick pattern on higher timeframes is being supported by micro-trend liquidity.
However, traders must remain cautious of the “Warsh Shock” rejection. While J.P. Morgan and other major analysts maintain a year-end target of $6,300, the immediate path is fraught with volatility. The partial US government shutdown has delayed critical labor data, making the market highly sensitive to unexpected headlines.
Conclusion: A High-Octane Trading Session
Our Gold Intraday Forecast 2026 highlights a market that is aggressively shaking off speculative froth. The rebound from the $4,400 lows indicates that institutional demand remains robust. As long as the price maintains its M5 structural support above $4,825, the short-term bias remains “Moderately Bullish” with eyes on a potential return to $5,000 by the end of the week.