
Gold Price Crash: Analyzing the 5-Minute Market Meltdown
The Gold Price Crash witnessed on February 5, 2026, was not a gradual decline—it was a violent, vertical drop. In a mere 5-minute window, gold (XAU/USD) shed significant value, slicing through established support levels as algorithmic trading triggered a cascade of stop-losses. For the general public, this looks like a catastrophic failure of the world’s oldest safe haven. For professional institutions, however, this “flash” move often represents a tactical liquidity hunt before a major trend reversal.
As of today, the market is on a hair-trigger. We are currently navigating a “liquidity vacuum” created by a convergence of policy shocks and institutional repositioning after last week’s outsized rally. Whether you are a retail trader or a long-term investor, the next few hours will determine the gold trajectory for the rest of the quarter.
Technical Breakdown: The Anatomy of a Liquidity Hunt
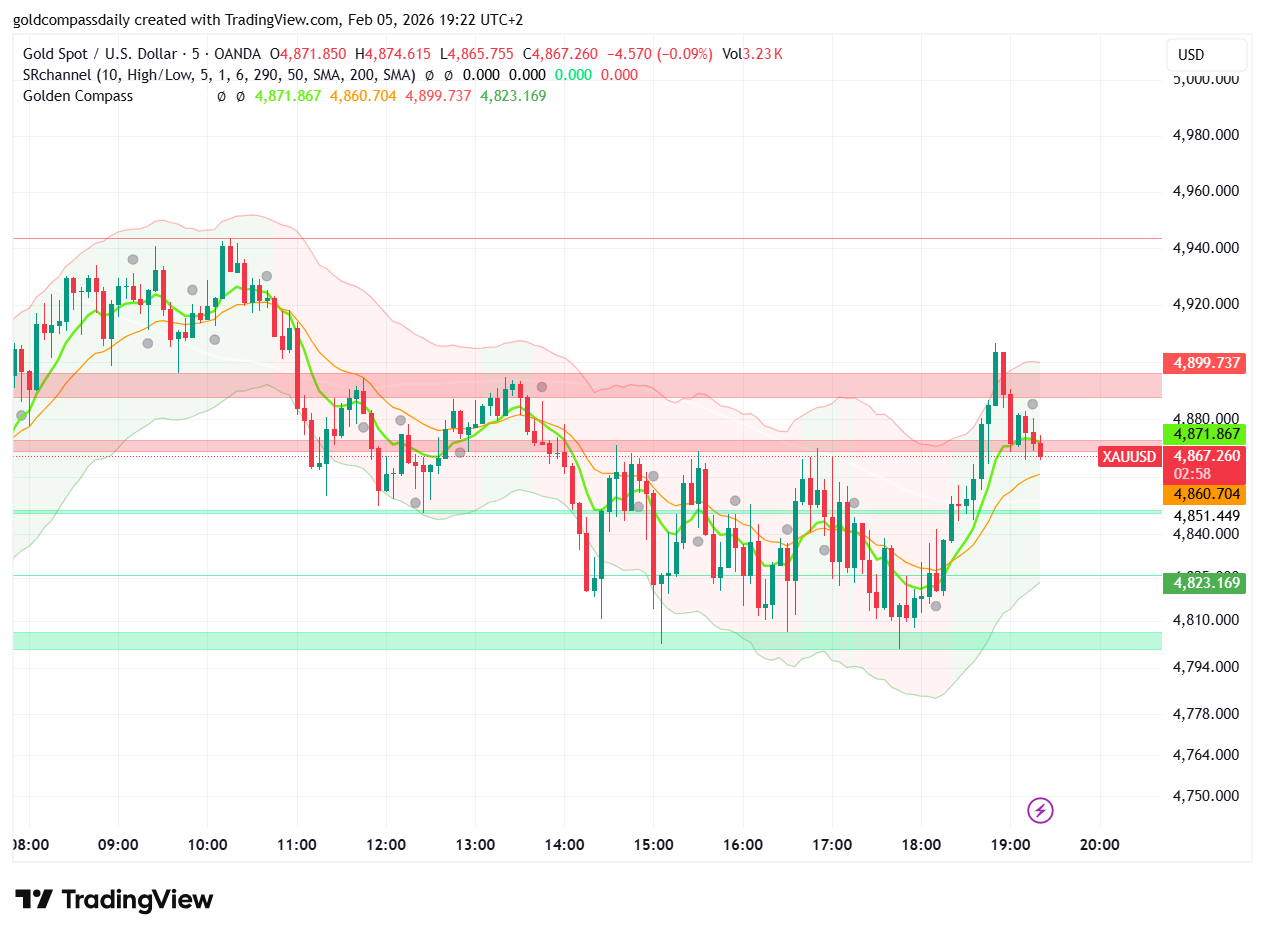
Looking at the 5-minute (M5) chart, the speed of today’s Gold Price Crash was driven by massive sell-offs in broader markets as the dollar hit near two-week highs. The price fell into a “no-man’s land” between $4,980 and $4,830 with almost no bids to catch it as traders reassessed risk.
- Immediate Support ($4,805 – $4,830): This is the current “floor.” If 5-minute candles start consolidating here instead of plunging further, it indicates that big buyers are finally stepping in to absorb the selling volume.
- Resistance Wall ($4,955): This level, which was a strong floor earlier, is now a heavy ceiling. Gold must reclaim this to prove today’s dump was a “fakeout”.
- Oversold Signals: Technical indicators show that gold is currently at extreme “oversold” levels. Historically, drops of this magnitude on a 5-minute scale often lead to a “snap-back” rally as weaker hands are cleared out.
The Central Bank Factor: Fed and BoE Standoff
The timing of this Gold Price Crash is no coincidence. While the Bank of England and ECB maintained status quo, a dovish tilt from the BoE initially seesawed prices before broader risk reduction took hold. Furthermore, hawkish rhetoric from Federal Reserve officials, emphasizing persistent inflation risks over a slowing labor market, has added significant downward pressure on bullion.
For the broader audience, this means the price swings you see are a reaction to fear and shifting policy expectations, rather than a change in underlying gold supply-demand fundamentals.
US Jobs Data: The Final Catalyst
Today’s labor market data added fuel to the fire. While initial jobless claims climbed to 231K—well above expectations—and January layoffs hit their highest level since 2009, gold extended losses as part of a broad deleveraging across crowded trades. Despite this, analysts like those at Goldman Sachs suggest the fundamental shift from the US dollar to precious metals remains a primary long-term driver.
Levels to Watch Now:
1. **The Trap:** Watch for a final “wick” down toward $4,800 followed by a massive recovery candle. This is the classic “Bull Trap” for those trying to short the absolute bottom.
2. **The Recovery:** A close above $4,955 on the M5 timeframe is the first sign of safety for those looking to buy the dip and target a return toward $5,115.
Conclusion: Stay Focused, Don’t Panic
Today’s Gold Price Crash is a reminder that the market is a master of deception. While the 5-minute chart looks like a disaster, structural drivers like geopolitical tensions and de-dollarization continue to support higher long-term allocations. Stay disciplined, respect your stop-losses, and remember: the biggest opportunities often come wrapped in the scariest charts.