XAU/USD Technical Update: Testing Fibonacci Support Before Bullish Continuation
T. S. Gospodinov
Tue, February 17, 2026 at 6:49 AM • 2 min read

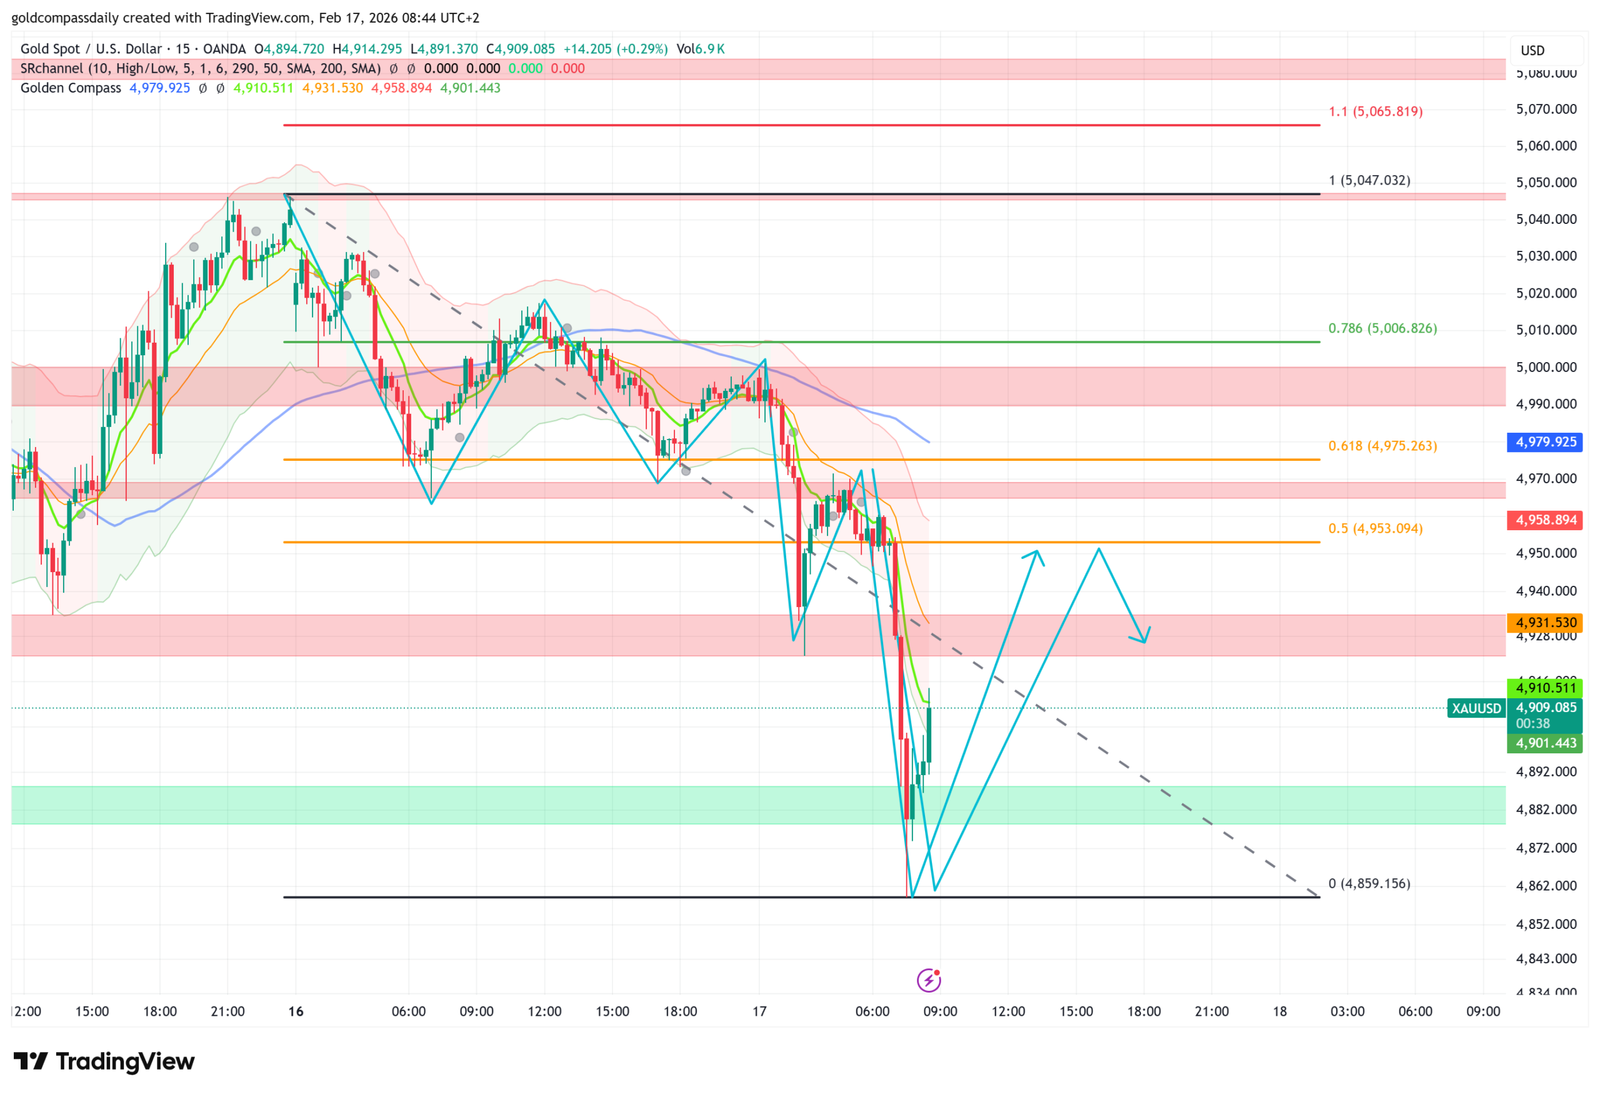
Following a robust recovery from early February lows, Gold (XAU/USD) has entered a pivotal consolidation phase as of February 17, 2026. Market structure currently suggests a high-probability “buy-the-dip” scenario, where a minor technical correction is expected to find support at key Fibonacci retracement levels before the primary bullish trend resumes its trajectory toward $5,140.
The Fibonacci Lens: Identifying the Correction Floor
The recent impulsive leg from the $4,400 monthly low to the $5,120 local peak has established a new range for Fibonacci analysis. Traders are closely monitoring the $4,940 – $4,960 zone, which aligns with the 23.6% and 38.2% retracement levels. Stability in this area would confirm that the current pullback is merely a corrective pause within a larger redistribution phase.
- Primary Support ($4,937 – $4,946): This zone represents a confluence of the 23.6% Fibonacci level and the 50-period EMA, making it a critical area for bulls to defend.
- Deep Correction Threshold ($4,820): A failure to hold the $4,940 handle could expose the 50% retracement level near $4,820, where larger institutional buyers are expected to re-emerge.
Upside Expansion: Targets Beyond the Pullback
As long as the price action respects the established trendline support, the “Green Path” remains the dominant outlook. A successful bounce from the Fibonacci clusters would likely lead to a retest of the psychological $5,000 level, followed by an expansion toward major resistance.
- Immediate Resistance: The $5,095 – $5,142 supply zone remains the primary hurdle for a trend continuation.
- Secondary Extension: A decisive breakout above $5,142 would activate Fibonacci extension targets at $5,266 and potentially the 76.4% retracement level at $5,315.
Technical Indicator Matrix
| Indicator Type | Key Level / Value | Market Signal |
|---|---|---|
| Fibonacci Pivot Point | $4,964.40 | Equilibrium Zone |
| Relative Strength (RSI 14) | 40.55 | Neutral/Bearish Pressure |
| 50-Period EMA (4H) | $4,942.00 | Dynamic Support |
| Trendline Support | $4,811.00 | Critical Floor |
Disclaimer: This technical analysis is for informational purposes only. Trading XAU/USD on margin involves substantial risk. Market conditions can shift rapidly ahead of high-impact events like the FOMC minutes release later this week.
Economic Calendar
Disclaimer
The content on Gold Compass Daily is provided for educational and informational purposes only. It does not constitute financial, investment, tax, or legal advice.