

Headline Thesis
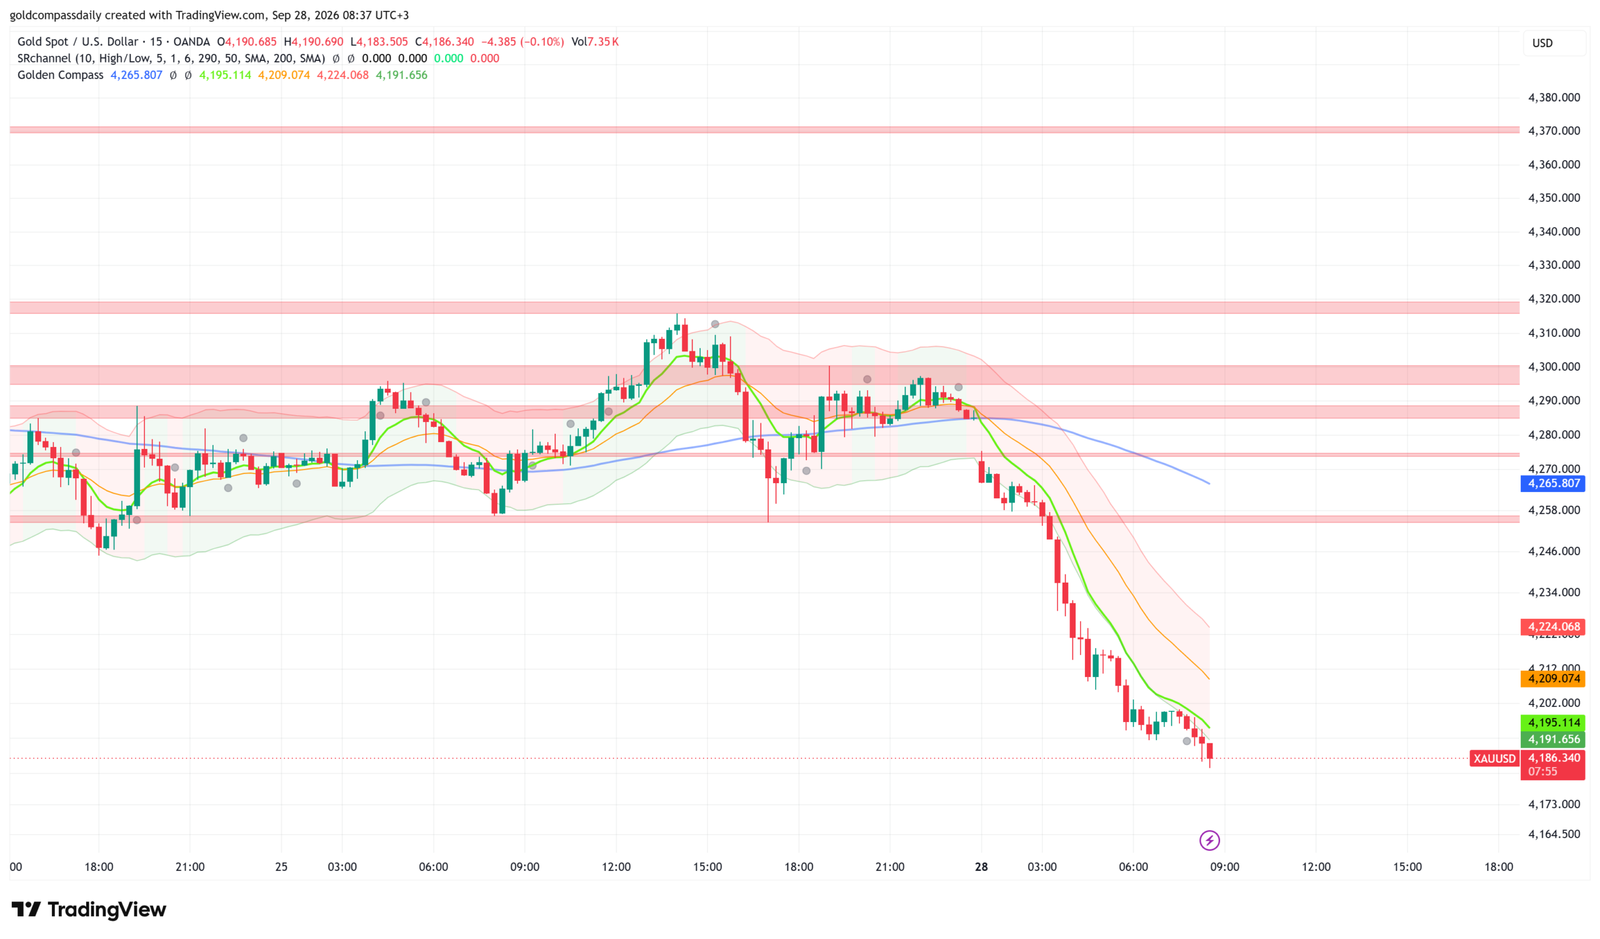
Gold trades bearish at $4,186 — a sharp Asian session sell-off extending Friday’s rejection from $4,286 has accelerated into Monday’s open, with the metal now testing multi-session lows as markets brace for a week dominated by Fed rhetoric and Friday’s Nonfarm Payrolls report. The path of least resistance remains lower as long as price holds beneath the $4,224 recovery level and all short-term moving averages continue to roll over in a bearish stack.
For broader weekly context and the NFP framework, see the Gold Week Ahead — Sep 28–Oct 2 hub. For Friday’s rejection analysis, see XAU/USD holds $4,271 after $4,286 rejection.
Key Levels
- Bias: Bearish below $4,224 — confirmed distribution structure in place
- Support: $4,183 (Asian session low) → $4,173 (chart base / next visible SR band)
- Resistance: $4,195 (short SMA, immediate) → $4,209 (mid SMA) → $4,224 (key recovery level) → $4,246 → $4,258
- Session target: $4,173 (conditional on failure to reclaim $4,195 on European open)
- Invalidation: A clean close above $4,224 on the 15-min chart would neutralize the immediate bearish structure and open the door to a retest of $4,246
Catalyst of the Day
Monday’s primary catalyst is the cluster of FOMC member speeches running through the US session: Governor Bowman at 3:15 PM ET, Governor Cook at 8:25 PM ET, and Richmond Fed President Barkin at 8:30 PM ET. This is not routine calendar noise — it is the Fed’s first coordinated communication opportunity following the September 16 rate hike, and markets will parse every word for signals on whether a second consecutive hike in November remains live. The Fed’s September decision delivered a hawkish 25 bps rate hike to a 3.75–4.00% target range, with officials maintaining that “inflation remains elevated” and upgrading economic activity to expanding at a “solid pace.” Any reinforcement of that hawkish framing from Bowman, Cook, or Barkin — particularly heading into NFP week — extends the dollar’s recent recovery and sustains selling pressure on gold. Watch Bowman’s remarks at 3:15 PM ET as the first directional signal of the day; a repeat of her recent inflation-concern language would immediately weigh on the $4,195 recovery attempt.
Fundamental Context
The CME Group probability tracker currently shows roughly a 60% probability of a rate hike at the September 16 meeting, and if the increase does not occur in September, markets still assign approximately a 54% probability of a hike in October. That November hike probability, now anchored by the Fed’s hawkish dot plot, is the structural weight on gold. Every piece of data that reinforces US economic resilience — and every Fed speaker who reaffirms the tightening bias — compresses the window for any sustained gold recovery. Non-yielding assets such as gold lose relative appeal directly as Treasury yields rise; following the NFP release in early September, 10-year Treasury yields resumed their upward trend and continued to trade near the 4.8% area, corresponding to the highest levels recorded in 2026. That yield environment has not reversed, and gold has been unable to mount a durable bid in this context.
The week’s macro sequence matters for gold positioning. Monday sets the tone through Fed speakers. Tuesday through Thursday deliver incremental labor-market signals via ADP and jobless claims. Friday’s NFP is the definitive test. Gold tumbled to near $4,395 in early September after the US Nonfarm Payrolls climbed by 162K, beating market expectations of 56K by a wide margin, with the upbeat data boosting expectations that the Fed could raise interest rates as soon as that month. The September meeting delivered exactly that hike. A second strong NFP print on Friday would cement November rate hike odds and open a new leg lower in gold. Conversely, soft data would deflate hike expectations and give gold its first legitimate recovery catalyst in weeks. Monday’s Fed speakers effectively preview which scenario is more probable — that is what makes this session consequential.
Japan’s Monetary Policy Meeting Minutes, released overnight, and the Services Producer Price Index reading of 3.7% year-on-year (above the 3.6% forecast) added a minor risk-off undertone to the Asian open, but had no direct gold impact. ECB President Lagarde speaks at 4:30 PM ET; any signal of additional European tightening would strengthen the broader anti-gold rate environment. MPC Member Ramsden’s comments at 1:00 PM ET are UK-specific and lower priority for XAU/USD direction, though GBP strength from hawkish remarks could indirectly support the USD-inverse dynamic.
Chart Analysis
The 15-minute XAU/USD chart (OANDA, September 28, 08:37 UTC+3) presents an unambiguous bearish structure. Price peaked near $4,315 during the Friday session, consolidated briefly in the $4,290–$4,300 range on Saturday’s close, then initiated a sharp waterfall sell-off beginning around 03:00 on September 28 that has accelerated through every visible SR band on the chart. The current session low of $4,183.50 confirms the input level of $4,183 with precision. All three moving averages — the short-term green SMA near $4,195, the mid-term orange SMA near $4,209, and the longer-term blue SMA near $4,265 — are stacked in a bearish sequence above price with downward slopes, indicating no near-term MA support. The Golden Compass proprietary indicator registers $4,265.807, sitting approximately $80 above the current price — a significant bearish divergence from current market levels. The SR channel bands at $4,246 and $4,258 were breached with minimal bounce, confirming distribution rather than a corrective move. The next visible structural support zone sits near $4,173, the lower chart boundary. A relief bounce toward $4,195–$4,209 is possible given the extent of the decline, but the structural evidence favors selling any recovery attempt beneath $4,224 until a reversal candle with volume confirms a floor.
Bull / Bear Scenarios
Bull Scenario
Trigger: Price reclaims and closes above $4,224 on the 15-minute chart during European session, combined with a notably dovish tone from at least one FOMC speaker. Target: $4,246 first, with potential extension toward $4,258 if momentum builds. This scenario requires external confirmation — it is not currently supported by price structure.
Bear Scenario
Trigger: Failure to hold $4,183 on the next test, confirmed by a 15-minute close below that level. Bowman or Barkin commentary reinforcing the November hike probability accelerates the move. Target: $4,173 immediately, with the $4,160–$4,165 area the next structural target on extension. This is the higher-probability scenario given current chart structure and the Fed calendar.
Events Ahead This Week
- Monday, Sep 28 — 3:15 PM ET: FOMC Member Bowman Speaks — First post-hike communication from a known inflation hawk; any reinforcement of elevated-rate language weighs on gold directly.
- Monday, Sep 28 — 4:30 PM ET: ECB President Lagarde Speaks — Further European tightening signals strengthen the broader rate-hike narrative and keep safe-haven demand suppressed.
- Monday, Sep 28 — 8:25–8:30 PM ET: FOMC Members Cook & Barkin Speak — Dual Fed commentary into the US close; conflicting signals could trigger short-term volatility around $4,195–$4,209.
- Wednesday, Sep 30: ADP Employment Change — Directional preview for Friday’s NFP; a strong print above 120K would accelerate hike pricing and extend gold’s downside.
- Thursday, Oct 1: ISM Manufacturing PMI / Jobless Claims — ISM above 50 would confirm economic resilience and support the hike case; claims below 220K would compound the hawkish read.
- Friday, Oct 3: US Nonfarm Payrolls (NFP) — The week’s defining event. A print above 130K extends the September pattern and pushes November hike odds above 70%, targeting gold below $4,150. A sub-80K miss deflates hike expectations and could trigger a relief rally toward $4,258–$4,270.
London Session Update
Price Check
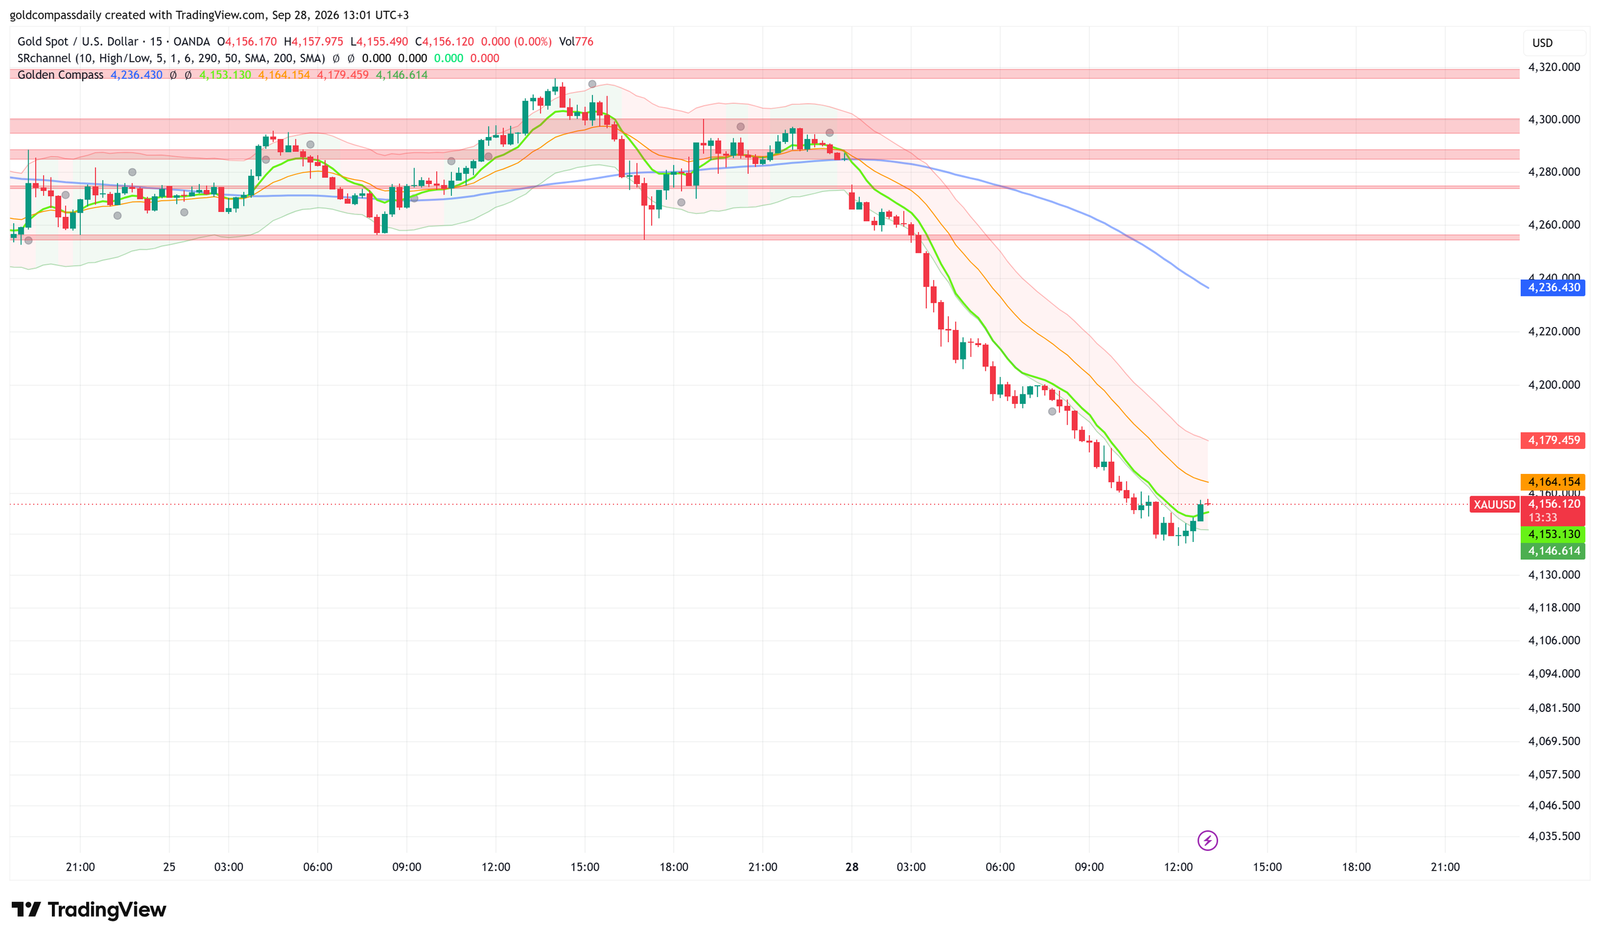
Gold trades at $4,156 as of the London midday fix — down approximately $30 from the morning open at $4,186, confirming the bearish bias outlined in Gold Compass Daily’s morning analysis. The original sell/neutral thesis has held without deviation: every level projected as resistance has capped price, and the session low of $4,146 has been printed before a tentative stabilisation attempt emerged ahead of the New York handoff.
What Changed
The London open brought a second leg lower that extended the Asian session sell-off, with price breaking beneath the $4,173 structural target identified in the morning analysis and briefly touching $4,146 — a level not visible on the earlier 08:37 chart, now confirmed as the intraday floor. The move accelerated through the European fix window, consistent with institutional rebalancing flows and the absence of any offsetting European data catalyst. No material European releases altered the macro backdrop during the London session: ECB President Lagarde does not speak until 4:30 PM ET, and GBP MPC Member Ramsden’s earlier comments produced no lasting EUR or GBP strength capable of reversing dollar momentum. The DXY has retained its bid, keeping gold’s recovery attempts shallow. The only structural shift since the morning is that $4,146–$4,148 has now established itself as a confirmed intraday support zone, replacing $4,173 as the near-term floor.
Updated Levels
- Current price: $4,156
- Bias now: Bearish — unchanged; all SMAs remain stacked above price with downward slope; no reversal structure confirmed
- Updated support: $4,146 (session low / intraday floor) → $4,130 (next visible SR band on extension)
- Updated resistance: $4,153 (short SMA, immediate) → $4,164 (mid SMA) → $4,179 (upper Bollinger band) → $4,200 (psychological / prior structure)
- London session target: $4,146 retest (already achieved); NY handoff target $4,164 on a sustained bounce, or $4,130 on a break lower
Scenarios into the NY Handoff
Bull: Price holds above $4,153 (short SMA) on the London close and pushes through $4,164 with a 15-min close, opening a corrective move toward $4,179–$4,200 — not a reversal, a relief rally ahead of Bowman’s 3:15 PM ET remarks. Bear: Failure to reclaim $4,164 by NY open and a second close below $4,148 confirms the bounce as exhausted, targeting $4,130 and potentially $4,118 if Bowman delivers hawkish commentary on November hike probability.
Chart Analysis
The 15-minute chart (OANDA, September 28, 13:01 UTC+3) shows a continuous bearish structure from the Friday peak near $4,300, with the entire visible price action consisting of lower highs and lower lows. The session low of $4,146 was printed just before the 13:00 candle, where a minor demand cluster has produced a tentative bounce — price has recovered to $4,156, marginally above the short green SMA at approximately $4,153. This SMA cross is not yet a signal: the green SMA is still pointing downward, and price has not produced a confirmed higher low. The mid-term orange SMA sits near $4,164 and the long-term blue SMA at $4,236 — both well above price and continuing to slope lower, confirming the dominant trend is intact. The Golden Compass indicator reads $4,236.43, a full $80 above current price, reinforcing the distribution thesis. The dashed horizontal SR band near $4,146–$4,148 is the only structural floor visible below the current candle; a clean break below it opens a wide gap to approximately $4,130. The current bounce has the characteristics of a corrective pause — low momentum, no expansion candles to the upside, all dynamic resistance overhead. The projected path into the NY open favours a test of the $4,153–$4,164 resistance band before the next directional decision is made.
New York Session Update
Price Check
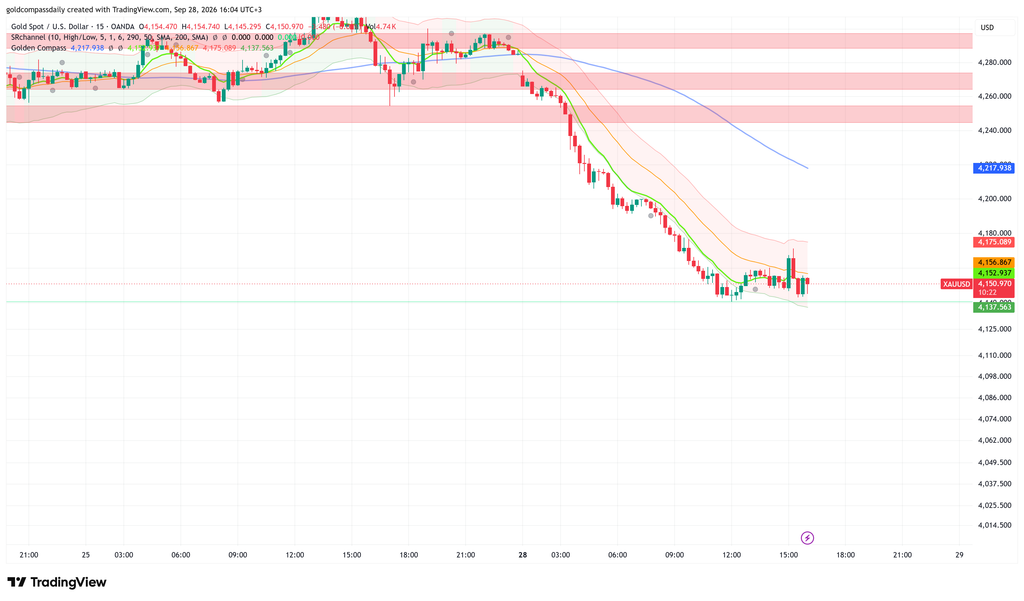
Gold holds at $4,151 as New York enters its opening hour — the bearish bias from Gold Compass Daily’s morning analysis remains structurally intact, though the metal has now twice defended the $4,137–$4,146 zone, producing a tentative base that was not visible at the London update. Price has not broken lower since the 09:00 UTC+3 flush, and a cluster of absorption candles suggests selling pressure is momentarily exhausted at current levels.
What Changed
The New York open has introduced the first genuine ambiguity of the session. FOMC Governor Bowman’s remarks at 3:15 PM ET are now the immediate market-moving event, and positioning ahead of that speech is producing choppy, low-conviction price action around the $4,148–$4,156 band. No material US data has printed to shift the macro narrative since the London update, but the double-bottom structure forming at $4,137–$4,146 — with each test showing diminishing sell-side follow-through — indicates that short-term bearish momentum is fading even if the dominant trend has not reversed. The critical distinction is between a technical bounce driven by exhaustion and a genuine directional shift: the former targets $4,175–$4,180 before sellers reload, the latter requires a Bowman catalyst and a clean break above $4,200. Neither is confirmed yet.
Updated Levels
- Current price: $4,151
- Bias now: Cautiously bearish — structure unchanged but $4,137 double-bottom introduces short-term upside risk; bias flips neutral only on a 15-min close above $4,175
- Updated support: $4,146 (intraday floor, tested twice) → $4,137 (session low / lower Bollinger band)
- Updated resistance: $4,153 (short green SMA) → $4,157 (mid orange SMA) → $4,175 (long blue SMA / key pivot) → $4,180 (SR band)
- NY session target: $4,175 on a sustained bounce; $4,130 on a break below $4,137
Scenarios into the Close
Bull: Price clears and closes above $4,157 (mid orange SMA) before Bowman speaks, then dovish or neutral commentary removes the November hike premium — target $4,175–$4,180, with potential extension to $4,200 into the Asian close. Bear: Bowman reaffirms hawkish November stance, price fails to hold $4,146 on the subsequent sell-off, and a 15-min close below $4,137 opens a measured move toward $4,118–$4,125 into the session close.
Chart Analysis
The 15-minute chart (OANDA, September 28, 16:04 UTC+3) shows the dominant downtrend from Friday’s $4,300 peak fully intact, but with early signs of a consolidation base forming at the $4,137–$4,150 level. Price has printed two tests of the $4,137 low — corresponding to the lower Bollinger band — with each successive candle showing smaller bear bodies and increasing lower wicks, indicating absorption rather than continuation. The short green SMA ($4,153) and mid orange SMA ($4,157) are converging tightly just above current price, creating an immediate resistance cluster that price must close through to validate any recovery thesis. The long blue SMA at $4,175 represents the first meaningful structural resistance beyond that cluster and aligns with the upper boundary of the current Bollinger band expansion. The Golden Compass reads $4,217.938 — still $67 above price, confirming the macro distribution structure has not been repaired. The projected path favours a test of $4,153–$4,157 in the next two to three candles; a rejection there and the double-bottom fails, targeting $4,130. A clean break and hold above $4,175 would be the first technically significant recovery signal of the entire session.
Analysis based on the XAU/USD 15-minute chart as of September 28, 2026, 08:37 UTC+3. This article is for informational and educational purposes only and does not constitute financial advice.