
The short-term outlook for the leading cryptocurrency remains challenging as selling pressure continues to dictate the pace. This Bitcoin hourly chart update analyzes the 1-hour (1H) timeframe, where BTC/USD is struggling to find a solid floor after a series of aggressive liquidations. For traders operating on smaller timeframes, the current structure provides critical clues about the next localized move.
1H Structure: A Descending Momentum
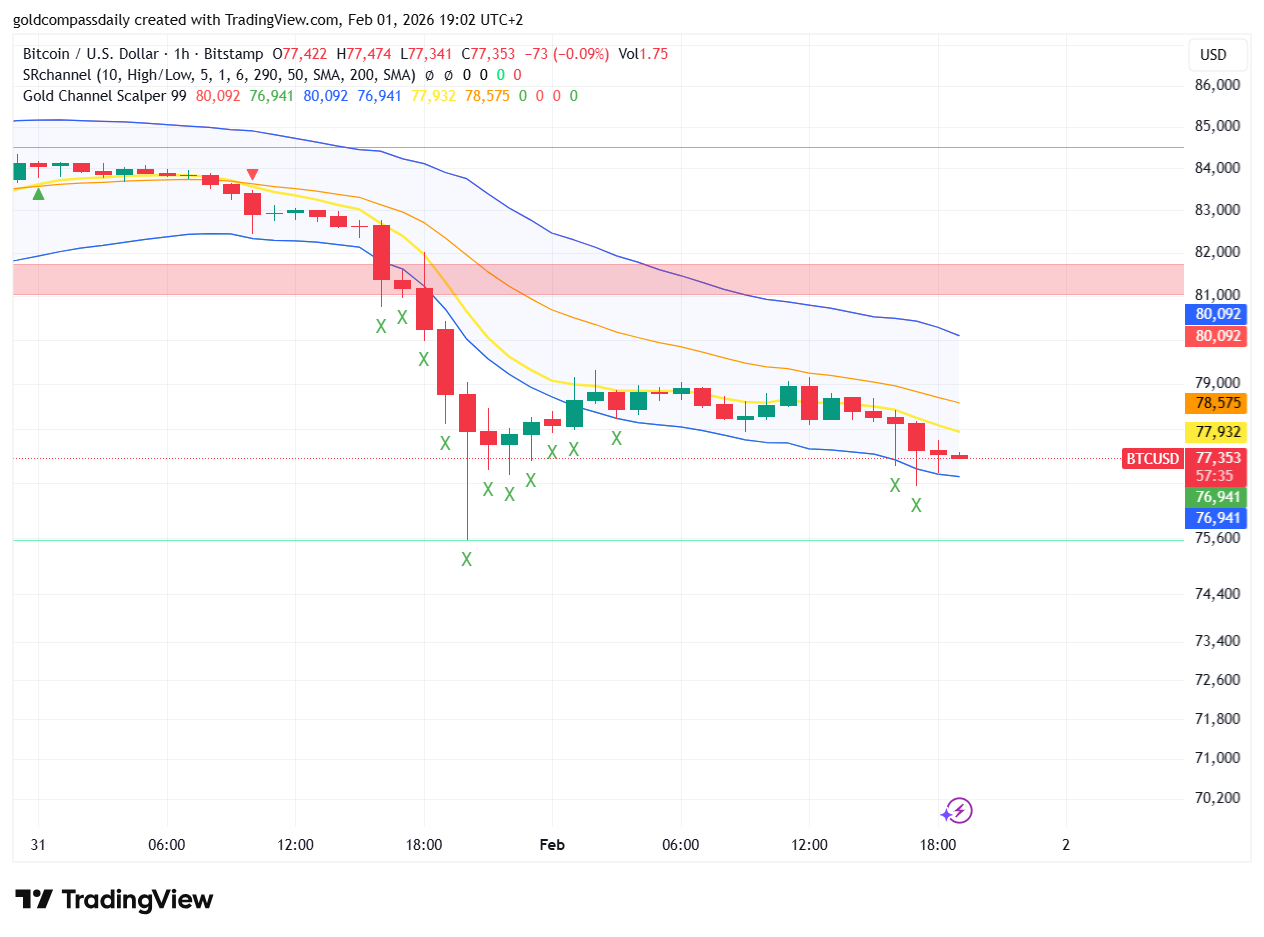
As seen in the latest 1H chart, the Bitcoin hourly chart update highlights a clear bearish channel. After a sharp drop from the $84,000 region, the price has entered a consolidation phase characterized by lower highs and lower lows. Currently trading at approximately $77,353, Bitcoin is testing the patience of short-term bulls who are looking for a reversal signal that has yet to materialize.
The price action is dominated by small-bodied candles followed by sudden, high-volume red candles. This pattern suggests that while there is some minor buying interest, it is insufficient to overcome the massive supply sitting just above the current market price. Each attempt to rally is being met with immediate selling, a classic sign of a “sell-the-rip” environment.
Indicators and the Gold Channel Scalper
Our Bitcoin hourly chart update relies heavily on the Gold Channel Scalper 99 indicator, which shows the price currently pinned between the midline and the lower volatility boundary. The midline, sitting at $78,575, has acted as a ceiling for the past several hours. The inability of the price to even touch the upper blue boundary ($80,092) indicates a severe lack of bullish momentum.
The “X” marks on the chart, provided by our scalping tool, indicate points of high-pressure selling. We are seeing a cluster of these signals near the $78,000 and $79,000 levels, confirming that these are now heavy supply zones. Furthermore, the 1-hour 200 SMA is trending well above the current price, adding a layer of dynamic resistance that will be difficult to breach without a significant fundamental catalyst.
Critical Intraday Levels
Based on this Bitcoin hourly chart update, traders should keep a close eye on these specific price points:
- Immediate Support ($76,941): This is the current local bottom on the 1H chart. A breach below this level could lead to a rapid slide toward the $75,600 liquidity pool.
- Immediate Resistance ($77,932): The nearest yellow line on our indicator. Bulls need to reclaim this level just to gain some breathing room.
- Key Supply Zone ($78,901 – $80,092): This area is packed with previous support levels that have now turned into resistance. Expect heavy fighting if the price manages a corrective rally to this zone.
Market Sentiment and Volume Analysis
Volume on the 1-hour timeframe remains relatively thin, which is typical for a Sunday evening before the Asia Open. However, this thin liquidity can lead to exaggerated price swings. The Bitcoin hourly chart update shows that the largest volume spikes over the last 24 hours have consistently occurred on “down” candles, reinforcing the bearish bias.
The broader market sentiment remains cautious. With the VIX showing signs of stress and traditional markets preparing for a heavy economic week, crypto traders are de-risking. Bitcoin is currently sensitive to every minor shift in the US Dollar Index (DXY), and until we see a decoupling or a weakening of the USD, the pressure on BTC/USD is likely to remain skewed to the downside.
Conclusion: The Intraday Strategy
To wrap up this Bitcoin hourly chart update, the short-term trend is undeniably bearish. For scalpers, the strategy revolves around looking for exhaustion at resistance levels near $78,500. For swing traders, the current 1H structure does not yet offer a safe “long” entry point, as the risk of a final “capitulation wick” toward $75,000 remains high.
As we head into the Monday morning session, volatility is expected to increase. We recommend keeping your leverage low and your stop-losses tight. The current market structure favors those who are patient enough to wait for a confirmed breakout or a deep retest of major historical support levels.
Stay tuned for our next update as the London session opens, where we will look for shifts in volume that could signal a temporary bottom or a continuation of this downward move.

Written by T. S. Gospodinov
T. S. Gospodinov is an Independent gold market analyst focused on liquidity structures and macro-driven price cycles.


