
Bitcoin Price Outlook: Decoding the February 2026 Liquidation
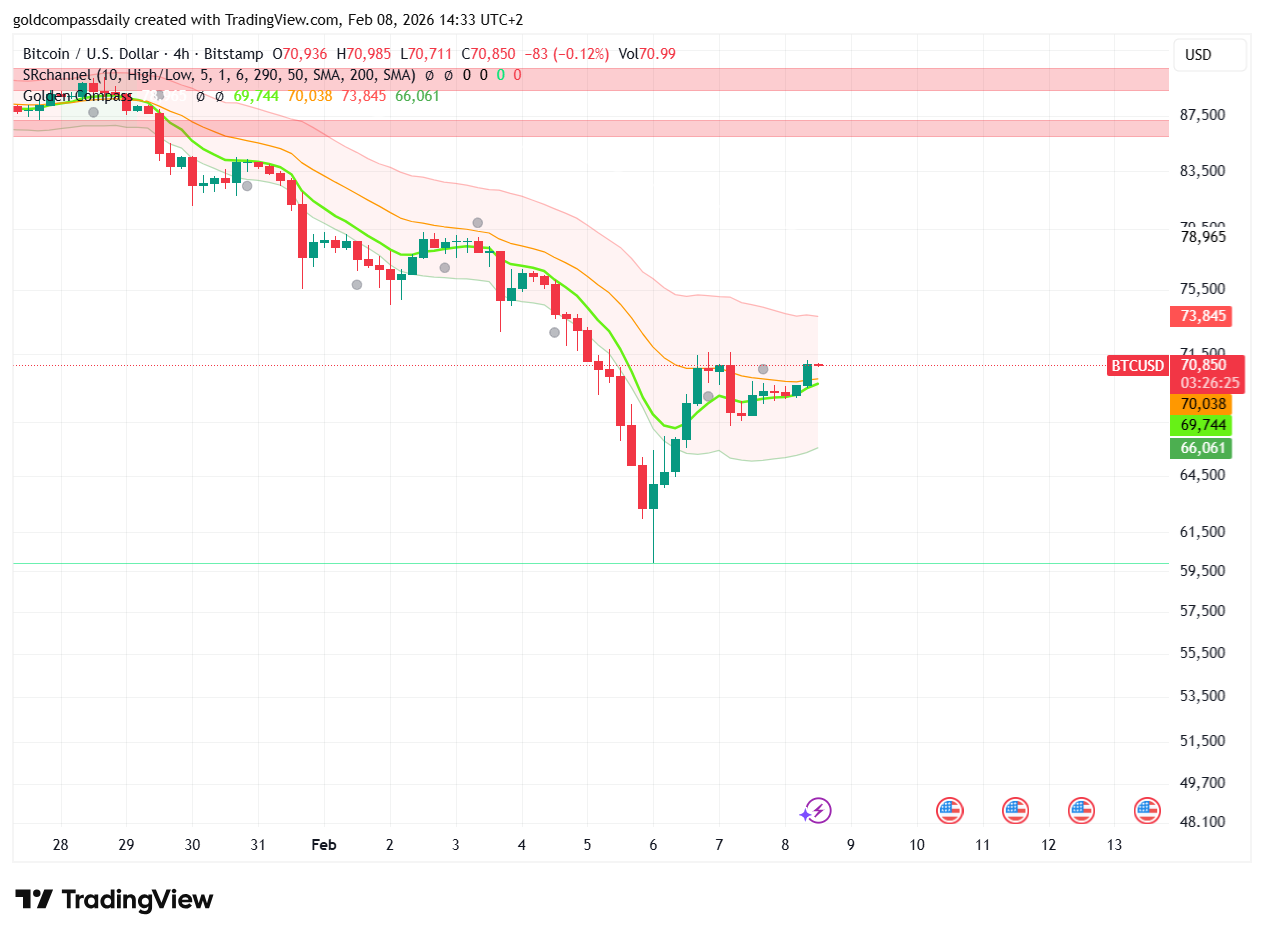
The global crypto landscape was shaken to its core this week. On February 5, 2026, Bitcoin suffered one of its most historic selloffs, plummeting from $73,000 to a local low near $60,000 in a single day—a 14% decline that wiped out over $500 billion in market value. This Bitcoin Price Outlook examines whether the current recovery to $69,300 is a genuine reversal or merely a “dead cat bounce” before a deeper correction toward the 200-week moving average near $58,000.
For the general public, this move looked like a total collapse of the “safe haven” narrative. For seasoned traders, however, the single-digit “Fear and Greed Index” and extreme oversold RSI levels suggest we are approaching a major cyclical bottom.
Technical Breakdown: The 4-Hour “Air Pocket”
Analyzing the 4-hour chart reveals that Bitcoin fell through an “air pocket” after breaking below the $74,000 support level. This drop was fueled by a combination of collapsing leverage, miner capitulation, and fading institutional ETF inflows.
- The Support Floor ($60,000 – $62,000): This zone has proven to be a massive demand area. Roughly 10 million BTC are currently held at a loss, a metric that historically aligns with major market bottoms.
- The Resistance Ceiling ($74,000): To confirm a full recovery, Bitcoin must reclaim this level on high volume. Until then, the market remains in a high-risk consolidation phase.
- Whale Behavior: Despite the panic, long-term investors and new institutional addresses are actively accumulating at these lower prices.
Why Institutional Demand “Walked Away”
The Bitcoin Price Outlook was blindsided by a sudden shift in institutional structure. By early 2026, the arbitrage gap between US-based exchanges like Coinbase and offshore platforms vanished, causing hedge funds to unwind billions in structural demand. This was compounded by fears of a “hard money” regime from a potentially hawkish Federal Reserve, driving capital into high-yielding traditional assets.
However, analysts from firms like Bernstein and Standard Chartered remain optimistic for the second half of 2026, maintaining year-end targets between $150,000 and $200,000 based on the expected “tokenization super cycle”.
Strategic Forecast: The Path to $120,000
While the short-term outlook is dominated by volatility, the long-term Bitcoin Price Outlook is buoyed by constrained supply and the typical four-year boom-bust cycle. If Bitcoin can stabilize above the $70,000 mark in the coming days, it opens the door for a grind upward toward the $120,000–$170,000 range by the end of 2026.
Levels to Watch This Week:
1. **The Bounce Zone ($68,000 – $70,000):** Sustaining price action here is critical to keeping the bullish structure alive.
2. **The Danger Zone ($58,000):** A breach of the 200-week moving average would likely confirm a “Crypto Winter” reset.
Conclusion: Volatility is the Entry Price
The recent crash is a stark reminder that even the largest cryptocurrencies are sensitive to leveraged positioning and shifts in global liquidity. The Bitcoin Price Outlook for the rest of February will depend heavily on whether institutional ETF flows resume or if the “risk-off” sentiment persists. Stay disciplined, watch the key supports, and remember: history shows that crypto rallies often start when fear is at its highest.

Written by T. S. Gospodinov
T. S. Gospodinov is an Independent gold market analyst focused on liquidity structures and macro-driven price cycles.


