
As of February 11, 2026, Bitcoin (BTC/USD) is experiencing a notable correction, trading around $66,608 per coin, down 2.24% from recent highs. This follows a multi-week uptrend where prices peaked near $72,524 before retreating sharply. Current spot prices range from $66,608 low to $68,134 high, according to real-time data from Bitstamp and TradingView, with volume at 705.11 indicating increased selling pressure. For everyday holders monitoring crypto volatility, and for active traders navigating the pullback, this Bitcoin price today analysis examines the 4-hour chart dynamics, fundamental influences, and possible recovery scenarios. With market sentiment shifting and U.S. data looming, could this dip mark a healthy reset or deeper correction?
Current Bitcoin Price Today Overview
Bitcoin has pulled back significantly over the past week, retreating from highs near $72,524 in early February to current levels below $67,000. By mid-morning UTC, BTC/USD has closed the latest 4-hour candle at $66,608, reflecting a net loss of about 2.24% intraday. This movement comes amid elevated volume (705.11), suggesting liquidation activity. Over the past month, Bitcoin has gained roughly 5–10% from January lows, but year-over-year gains remain strong, with market cap near $1.3 trillion per CoinGecko and Yahoo Finance reports.
For non-traders, Bitcoin’s price swings often reflect broader risk sentiment – dropping when equities falter or uncertainty rises. Today, with global economic data on the horizon, this correction could present entry points for long-term holders via exchanges or ETFs, without requiring precise timing.
Technical Breakdown: The 4-Hour Chart Insights
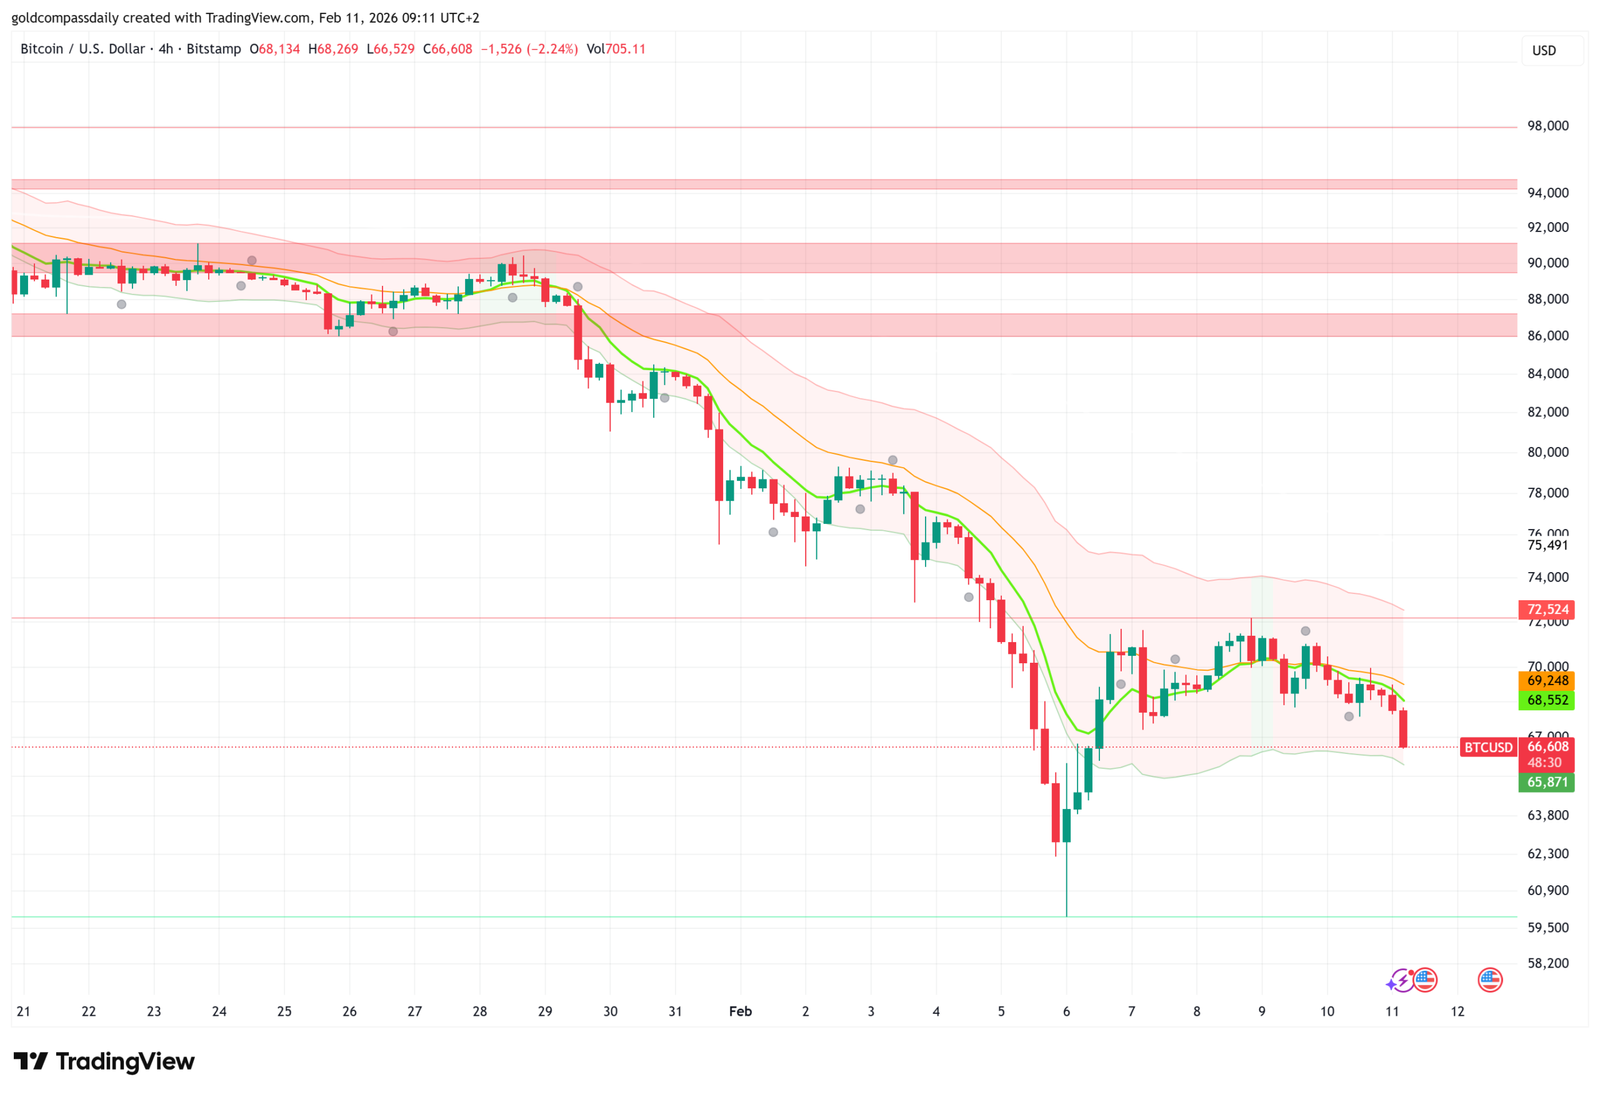
The 4-hour TradingView chart for BTC/USD illustrates a clear bearish correction within a larger consolidation range. Covering January 21 to February 11, prices formed a strong uptrend from $58,200 lows on Jan 21 to peaks near $72,524 by Feb 7–8. Red candles dominated the pullback, with a sharp drop from $70,000 to $66,608, testing lower channel boundaries and forming lower highs/lows.
Key technical levels on the 4-hour timeframe include:
- Resistance ($68,248–$69,248): This zone has rejected recoveries multiple times; a sustained break above $68,248 could target $69,926–$70,029, signaling potential reversal.
- Support ($66,608–$65,871): The session low at $66,608 acts as immediate pivot. Holding here prevents deeper slides to $65,000–$64,350, while a bounce could form a higher low.
- Moving Averages & Indicators: The 50-period SMA at ~$69,248 now provides overhead resistance, with shorter MAs sloping downward in a bearish crossover. Momentum indicators show oversold conditions, hinting at possible short-term bounce if volume supports.
The chart’s descending pattern suggests profit-taking after gains – a common “healthy correction” in bull markets where weak hands exit before the next leg up. For beginners, this means Bitcoin is cooling off, potentially setting up for recovery if buyers return at lower levels.
Fundamental Drivers Shaping Bitcoin Prices
Fundamentally, today’s drop is driven by risk-off sentiment and profit-taking ahead of U.S. data (NFP, Unemployment Rate tomorrow). Regulatory uncertainty (SEC ETF reviews) and macro caution (potential Fed hawkishness under Warsh) add pressure, but positive inflows into Bitcoin ETFs (BlackRock’s IBIT records) provide underlying support. Global adoption trends, including emerging market wallet growth and corporate treasuries, remain bullish long-term.
Analysts from CoinGecko and Binance forecast $80,000+ by Q2 2026, citing halving cycle effects and scarcity. For average readers, this reinforces Bitcoin’s role as a high-growth asset – a diversifier for portfolios, accessible via apps, despite short-term volatility.
Trading Strategy: What to Watch Next
For traders on the 4-hour chart, the correction offers tactical plays: buy near $66,608 support with stops below $65,871, targeting $68,248–$69,248 for swing gains. Scalpers can fade resistances for shorts if momentum fades, using 1% risk in this elevated-volume environment (705.11).
Non-traders can dollar-cost average on dips below $67,000, leveraging the bull trend. Market psychology favors resilience after leverage flushes – this pullback clears weak positions, positioning for potential rebound as in prior cycles.
Conclusion: Correction Before Next Move
This Bitcoin price today analysis highlights a market in healthy correction mode, with the 4-hour chart suggesting potential rebound if support holds. While short-term risks from data loom, fundamentals like adoption keep the 2026 outlook constructive. Monitor $66,000–$70,000 levels closely, and remain disciplined amid volatility.
Bitcoin’s evolution as a mainstream asset persists – whether for active trading or long-term holding, today’s action provides key insights for all participants.

Written by T. S. Gospodinov
T. S. Gospodinov is an Independent gold market analyst focused on liquidity structures and macro-driven price cycles.


