
As of February 9, 2026, Bitcoin (BTC/USD) is capturing attention with a modest uptick, trading around $70,594.65, up 0.31% from recent levels. This follows a volatile week where prices tested highs near $72,200 before pulling back. Current spot prices hover between $69,570–$70,515 according to sources like Yahoo Finance, MarketWatch, and MetaMask, reflecting a -1% to +0.3% daily change amid broader market sentiment. For everyday enthusiasts wondering if BTC is a good buy now, and for traders eyeing quick moves, this Bitcoin price today analysis unpacks the 1-hour chart action, underlying factors, and potential paths forward. With all-time highs at $126,080 and forecasts pointing higher, is this the spark for another bull run?
Current Bitcoin Price Today Overview
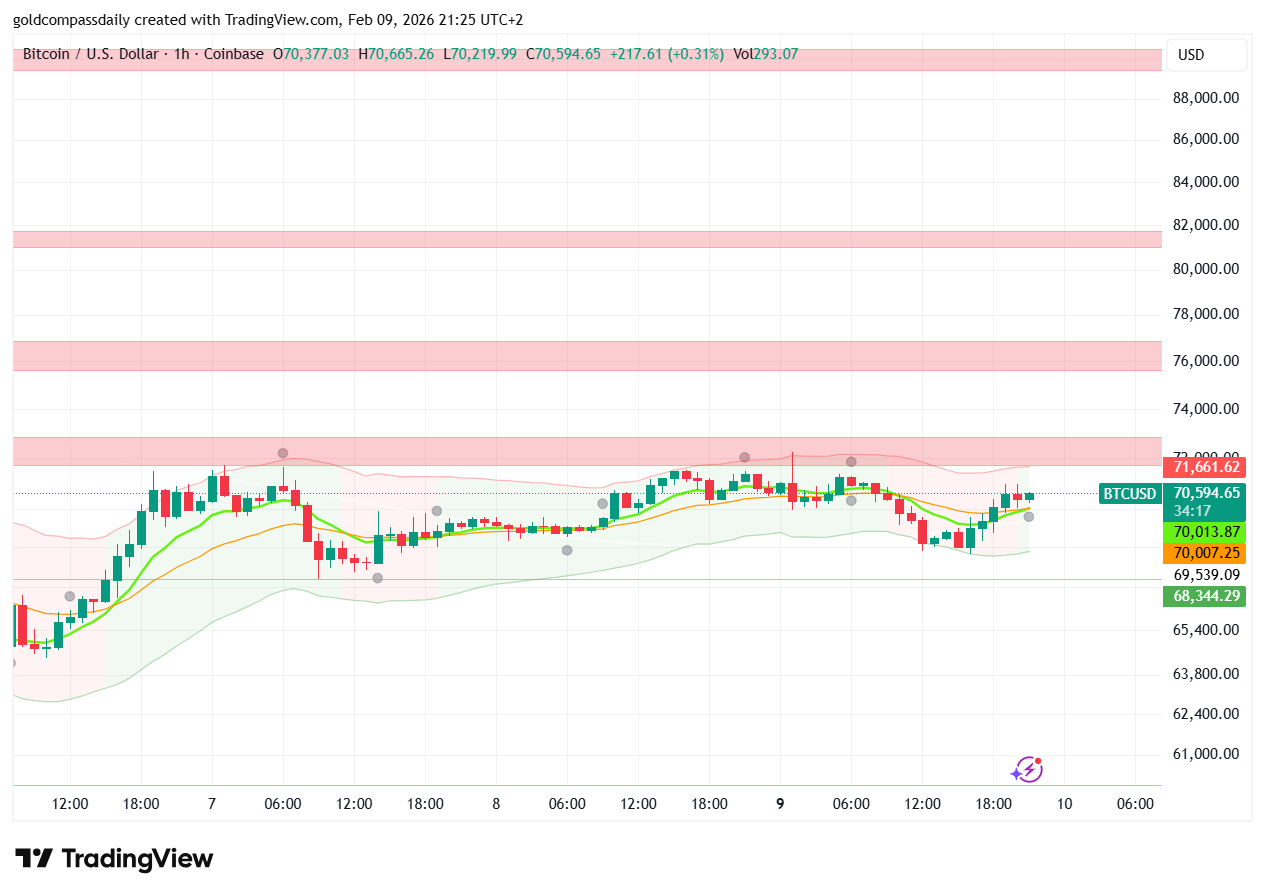
Bitcoin opened the session at $70,377.03, reaching a high of $70,665.26 and low of $70,219.99, closing the latest candle at $70,594.65 with volume at 293.07. Over the past 24 hours, BTC has gained about 1–2% in spots, recovering from early February dips around $68,000–$69,000. Year-over-year, Bitcoin is up massively, with market cap exceeding $1.38 trillion per MetaMask data. Recent trading on exchanges like Binance shows prices falling from a $72,200 high to ~$68,600, but stabilizing with bearish bias noted in some analyses.
For non-traders, Bitcoin represents digital gold – a store of value in uncertain times. With global adoption growing (e.g., more institutions holding BTC), monitoring Bitcoin price today can help decide on wallet investments or ETF exposure without needing pro-level skills.
Technical Breakdown: The 1-Hour Chart Insights
The 1-hour TradingView chart for BTC/USD displays a consolidation phase within an uptrend channel, marked by the SR Channel indicator. Covering February 6–9, prices climbed from ~$68,344 at 06:00 on Feb 7 to peaks around $71,000 by Feb 8, followed by a red candle pullback testing lower supports. The latest bars show volatility: a series of green candles building momentum, interrupted by doji and red patterns indicating indecision, before a bullish close at $70,594.
Key levels to note:
- Resistance ($70,665–$71,661): This overhead cluster has rejected advances, with the Golden Compass upper band at $71,661.62. A sustained break could target $72,000–$72,760, aligning with recent highs from MarketWatch data.
- Support ($70,219–$69,539): The session low here serves as immediate pivot. Holding prevents deeper slides to $68,000, while a bounce reinforces bullish structure.
- Moving Averages: The 50-period SMA at ~$70,013 curves upward, providing dynamic support above the 200-period at $69,539. Momentum shows slight overbought signals, but the overall pattern resembles a “flag” formation – a continuation setup in bull markets.
The chart’s V-shaped dips and recoveries suggest accumulation amid volatility. For beginners, this means Bitcoin often “shakes out” weak hands before rallying – a pattern seen in past cycles.
Fundamental Drivers Impacting Bitcoin Price Today
Fundamentally, Bitcoin’s price is buoyed by institutional flows and macro shifts. Robinhood’s prediction markets show high confidence in BTC above $69,500–$70,000 by Feb 9 close, reflecting optimism despite recent dips. Regulatory news, like potential Fed rate adjustments under Warsh’s nomination, influences sentiment – a hawkish stance could strengthen the dollar, pressuring crypto, but softer data (e.g., upcoming NFP) might fuel rallies.
Global factors include ETF inflows (BlackRock’s IBIT hitting records) and adoption in emerging markets. Binance analyses note bearish bias short-term due to overleveraged positions, but long-term forecasts from analysts like those at Trading Economics predict $80,000+ by Q2 2026, citing halving cycles and scarcity. For average readers, this translates to opportunity: Bitcoin isn’t just speculative; it’s increasingly a portfolio diversifier amid stock market uncertainties.
Trading Strategy: What to Watch Next
For traders, the 1-hour chart offers tactical entries. Bulls can buy breaks above $70,665 with stops below $70,219, targeting $71,661–$72,000. Scalpers might fade rejections at resistance for shorts to $69,539, using 1% risk rules in this high-vol environment (293 volume indicates liquidity). Swing players should await confirmation post-U.S. data for longer holds.
Non-traders can dollar-cost average via apps like Coinbase on dips below $70,000, betting on the bull trend. Market psychology leans optimistic after flushing leverage (as seen in Binance’s $68,600 low), with “healthy corrections” setting up for new highs. As Yahoo Finance historical data shows, BTC often rebounds 10–20% post-dips in bull markets.
Conclusion: Bullish Potential Amid Volatility
This Bitcoin price today analysis reveals a market consolidating gains, with the 1-hour chart hinting at upside if resistances crack. While short-term risks from data and leverage loom, fundamentals like adoption and scarcity support higher prices in 2026. Monitor $70,000–$71,000 levels, and avoid FOMO in volatile sessions.
Bitcoin continues to evolve as a mainstream asset – whether for quick trades or long-term wealth, its trajectory remains compelling.

Written by T. S. Gospodinov
T. S. Gospodinov is an Independent gold market analyst focused on liquidity structures and macro-driven price cycles.


