
As of February 10, 2026, Bitcoin (BTC/USD) is showing signs of recovery in early trading, with XAU/USD rebounding to $69,643.01 per coin, up 0.28% from session lows. This follows a consolidation phase where prices tested supports near $69,411 before bouncing back. Current spot prices range from $69,411.47 low to $69,811.53 high, according to real-time data from Coinbase and TradingView, with volume at 113.7 indicating moderate participation. For everyday holders wondering if now is a good time to add to their BTC position, and for traders scanning for short-term setups, this Bitcoin price today analysis breaks down the 1-hour chart movements, key drivers, and potential paths ahead. With institutional inflows and macro factors in focus, is this rebound the start of a stronger move?
Current Bitcoin Price Today Overview
Bitcoin entered the new trading day with cautious momentum, recovering from overnight dips around $69,000–$69,400 after yesterday’s flat close. By 06:26 UTC+2, BTC/USD has climbed to $69,643.01, closing the latest 1-hour candle with a +192.27 gain (+0.28%). This represents resilience in a low-volatility environment, with prices up approximately 1–2% from recent lows. Over the past week, Bitcoin has stabilized around $69,000–$70,000, and year-over-year gains remain strong, with market cap near $1.38 trillion per CoinGecko and Yahoo Finance data.
For non-traders, Bitcoin serves as a “digital reserve asset” – its price often rises with adoption and risk appetite. Today, amid global economic uncertainty, tracking Bitcoin price today can inform decisions on crypto wallets, ETFs, or long-term holdings, without needing advanced chart reading skills.
Technical Breakdown: The 1-Hour Chart Insights
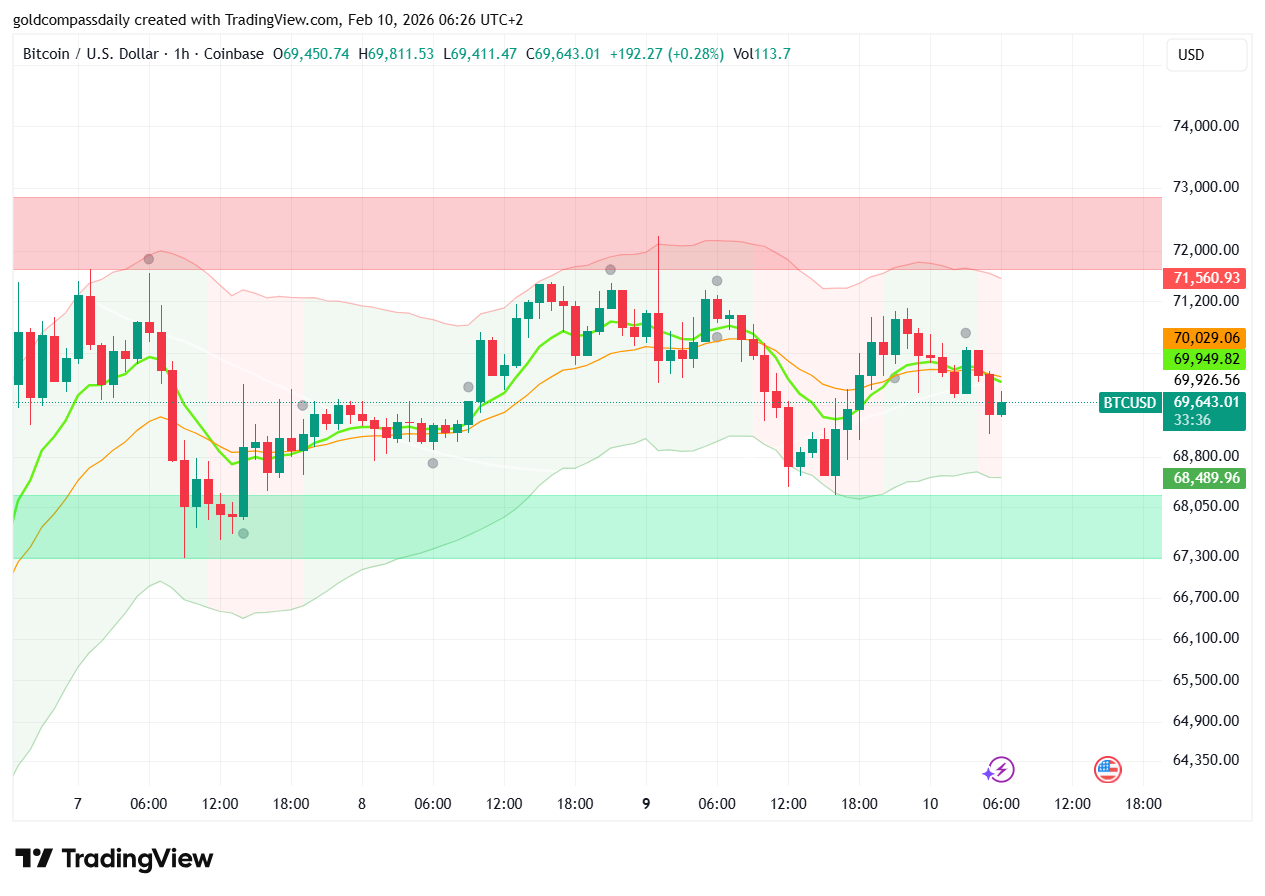
The 1-hour TradingView chart for BTC/USD displays a bullish reversal pattern within a broader consolidation range. Covering February 7–10, prices dipped to lows near $68,050 on Feb 8–9, forming a series of red candles testing lower channel boundaries. The latest bars show strong green momentum: a sharp rally from $69,411.47 low, pushing through the 50-period SMA at ~$69,949 and closing at $69,643.01 with increasing volume (113.7).
Key technical levels on the 1-hour timeframe include:
- Resistance ($69,811–$70,029): This zone has acted as a ceiling recently. A sustained break above $69,811 could target $70,285–$71,560, aligning with the Golden Compass upper band at $71,560.93.
- Support ($69,411–$68,890): The session low at $69,411 serves as immediate defense. Holding here prevents retesting $68,000, while a bounce confirms bullish continuation.
- Moving Averages & Indicators: The 50-period SMA at ~$69,949 now provides dynamic support, with shorter MAs curving upward. Momentum indicators show positive divergence, suggesting building upside pressure despite low overall volume.
The chart’s “higher low” formation hints at accumulation – a common setup in bull markets where dips are bought aggressively. For beginners, this means Bitcoin is recovering from weakness, potentially gearing up for another leg higher if volume follows.
Fundamental Drivers Shaping Bitcoin Price Today
Fundamentally, today’s rebound is supported by steady ETF inflows (BlackRock’s IBIT continuing strong) and growing corporate adoption, offsetting short-term caution from U.S. data anticipation. Regulatory clarity (e.g., ongoing SEC ETF reviews) adds optimism, while macro factors like potential Fed rate pauses provide tailwinds for risk assets like BTC.
Global sentiment remains bullish: emerging markets see rising wallet usage, and halving cycle effects continue to support scarcity narratives. Analysts from CoinGecko and Binance maintain $80,000+ forecasts for Q2 2026, citing institutional demand. For average readers, this reinforces Bitcoin’s role as a portfolio diversifier – a hedge against traditional market volatility, accessible via exchanges or apps for long-term growth.
Trading Strategy: What to Watch Next
For traders on the 1-hour chart, the rebound offers clear setups: buy pullbacks near $69,411 support with stops below $68,890, targeting $69,811–$70,029 for quick gains. Swing traders should await a close above $69,811 to enter longs toward $71,560, using 1% risk in this moderate-volume environment (113.7).
Non-traders can dollar-cost average on dips below $69,000, leveraging the bull trend. Market psychology favors recovery – this bounce clears leverage from overextended shorts, setting the stage for potential new highs as seen in previous cycles.
Conclusion: Rebound Momentum Building
This Bitcoin price today analysis indicates a market regaining strength, with the 1-hour chart suggesting further upside if resistance breaks. While short-term volatility persists ahead of U.S. data, fundamentals like adoption and cycles keep the outlook constructive for 2026. Monitor $69,000–$70,000 levels closely, and stay disciplined in uncertain sessions.
Bitcoin’s path as a mainstream asset continues – whether for active trading or long-term holding, today’s action provides actionable insights for all participants.

Written by T. S. Gospodinov
T. S. Gospodinov is an Independent gold market analyst focused on liquidity structures and macro-driven price cycles.


