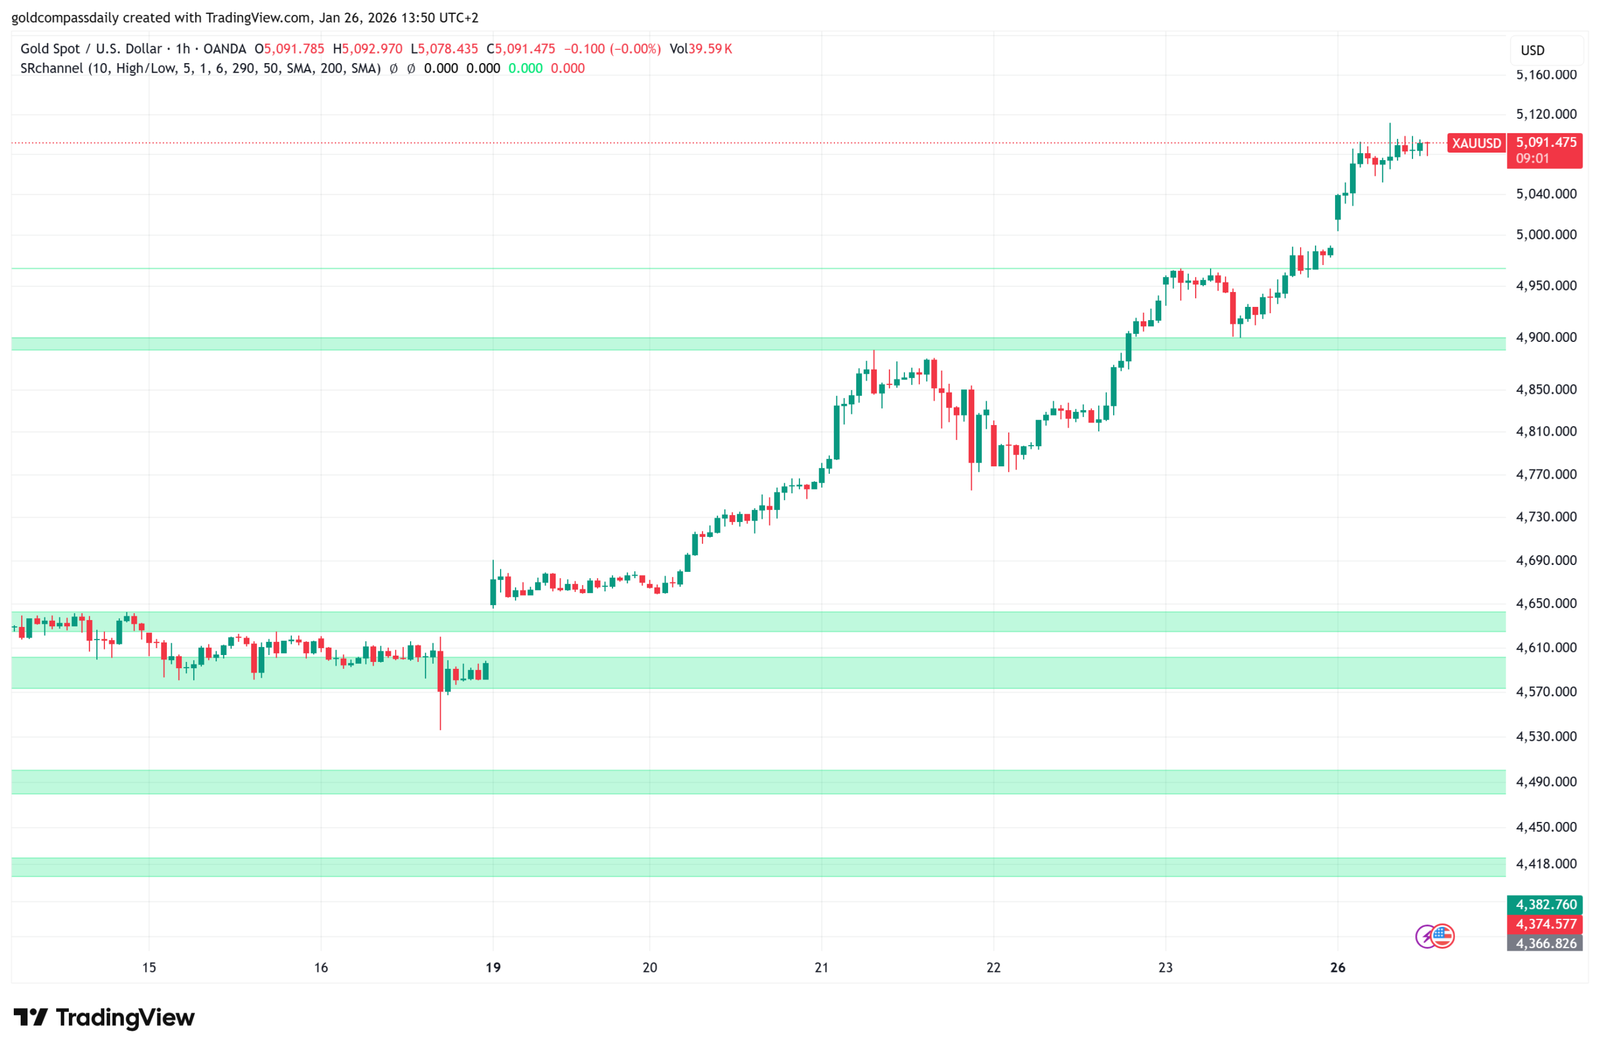
As we approach the midday lull before the New York session, the 1-hour (1H) chart of Gold (XAU/USD) reveals a fascinating battle between bulls and bears at the $5,091 – $5,100 frontier. After the explosive morning rally, the market is now entering a healthy consolidation phase.
Midday Technical Insights:
- The $5,100 Ceiling: The 1H candles show a clear hesitation to break decisively above $5,100. This is typical “profit-taking” behavior from morning traders clearing their positions before the U.S. data.
- Support Integrity: Notice the green support zones on the chart – the level at $5,040 has now become a rock-solid floor. As long as we stay above the previous 1H swing high, the trend remains structurally intact.
- Volume and Volatility: Trading volume has slightly tapered off, which is the “calm before the storm.” We expect a massive spike in liquidity once the U.S. Durable Goods Orders hit the wires at 15:30.
Strategic Outlook:
The current price action on the 1-hour timeframe suggests a “Flag Pattern” formation. In technical terms, this often precedes another leg up. If New York traders see the $5,090 level holding, we could see a quick squeeze toward $5,125 within the first hour of the U.S. open.
“Watch the 1H candle closes. A decisive close above $5,105 would be the signal that the second wave of the daily rally has begun.”
Trader’s Note: Keep an eye on the RSI on this timeframe. It is cooling off from extreme overbought levels, giving the market “room to breathe” before the next potential surge.

Written by T. S. Gospodinov
T. S. Gospodinov is an Independent gold market analyst focused on liquidity structures and macro-driven price cycles.