The intraday price action of XAU/USD is currently at a pivotal crossroads. This Gold 1H chart technical analysis dives into the recent hourly candles, which show a modest relief rally following a period of intense liquidation. After the price plummeted from the $5,600 highs, the bulls are finally showing some signs of life near the $4,650 support zone, but the overall market structure remains fragile as we move further into the February 2nd session.
Recovery Attempt: Analyzing the Hourly V-Bottom
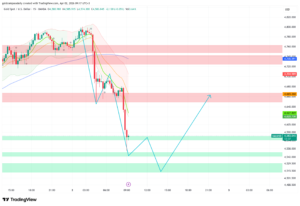
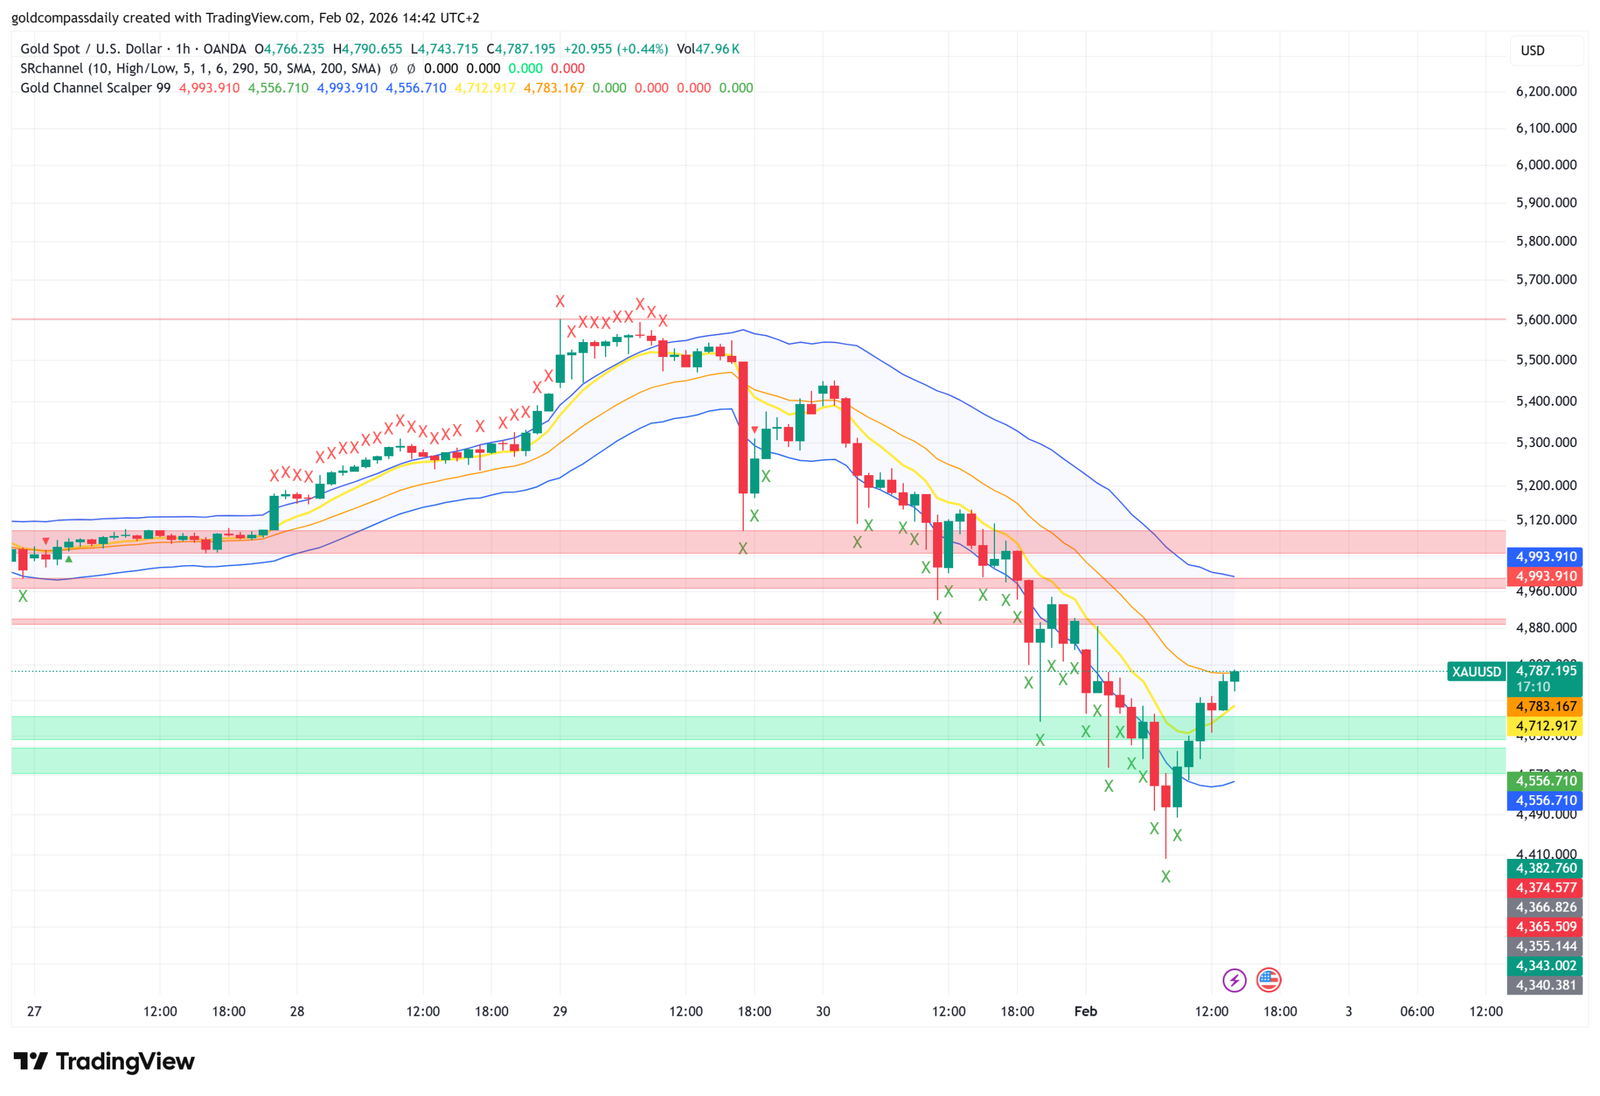
On the 1-hour timeframe, we can observe a series of bullish engulfing candles that have pushed the price back toward the $4,787 mark. Our Gold 1H chart technical analysis indicates that this move is driven by short-covering from traders who participated in the initial crash. The immediate goal for the buyers is to stabilize the price above the $4,750 horizontal support, which served as a major liquidity pool during the morning sell-off.
However, the recovery is meeting significant friction. The hourly moving averages are clustered just above the current price, creating a “resistance zone” between $4,830 and $4,900. For a true trend reversal to be confirmed, we need to see a 1H candle close with high volume above the $4,993 level (the red shaded area on the chart). Until then, this move is technically classified as a “dead cat bounce.”
Resistance and Support Levels to Watch
According to the Gold 1H chart technical analysis, the following levels are critical for day traders:
- Immediate Resistance ($4,850): This level aligns with the 50-period SMA. Rejection here could lead to a double-bottom test.
- The Red Supply Zone ($4,960 – $5,020): This is the “danger zone” where sellers are likely waiting to re-enter their short positions.
- Dynamic Support ($4,712): The lower green band on our chart. If this breaks, the next stop is the $4,550 liquidity zone.
Market Sentiment and Hourly Volume
The volume profile on the 1-hour chart shows a gradual decrease as the price ticks higher. In Gold 1H chart technical analysis, rising prices on declining volume often suggest a lack of conviction from institutional buyers. This “exhaustion” rally could be vulnerable to the upcoming US economic data releases, which historically bring a fresh wave of volatility to the gold markets.
The RSI (Relative Strength Index) on the 1H chart has moved out of the extreme oversold region (under 30) and is currently hovering around 45. This gives the price some “room to breathe” and potentially move higher before hitting overbought conditions again. However, the macro-outlook provided by the stronger US Dollar continues to cap the upside potential for all precious metals today.
The Impact of the New York Open
As the New York floor traders enter the market, the Gold 1H chart technical analysis expects a surge in volatility. The nomination of Kevin Warsh as the potential next Fed Chair has shifted the narrative toward a stronger dollar, which usually acts as an anchor for gold prices. Traders should be prepared for sudden “whipsaw” movements where the price spikes to trigger stop-losses before continuing its primary trend.
If the US session begins with a break above $4,800, we could see a quick move toward $4,880. If the session opens with a bearish engulfing candle on the 1H chart, it would signal that the sellers are back in control and ready to target the $4,600 support level once more.
Conclusion: Trading the 1-Hour Timeframe
In conclusion, the Gold 1H chart technical analysis suggests a cautious approach. While the $4,650 support has held temporarily, the overhead resistance is formidable. The “Green Channel” at the bottom of our chart remains the ultimate line in the sand for the bulls. Professional traders should look for signs of price exhaustion at the $4,850 – $4,900 levels to manage their risk effectively.
Stay tuned to Gold Compass Daily for our next update as the US manufacturing data hits the wires. Remember, in a high-volatility environment, protecting your capital is more important than catching every tick of the bounce.

Written by T. S. Gospodinov
T. S. Gospodinov is an Independent gold market analyst focused on liquidity structures and macro-driven price cycles.