The technical landscape for XAU/USD has undergone a tectonic shift over the last 48 hours. This Gold 4H chart analysis focuses on the aftermath of the historic rejection at the $5,600 psychological level and the subsequent waterfall sell-off that has redefined the short-term trend. As the New York session approaches its peak on February 2, 2026, the primary question for every macro trader is whether the current consolidation is a bottom or merely a pause before the next leg down.
The $5,600 Blow-off Top and the Liquidation Cycle
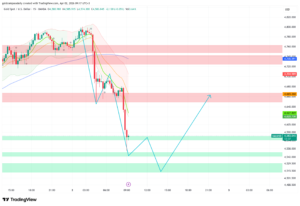
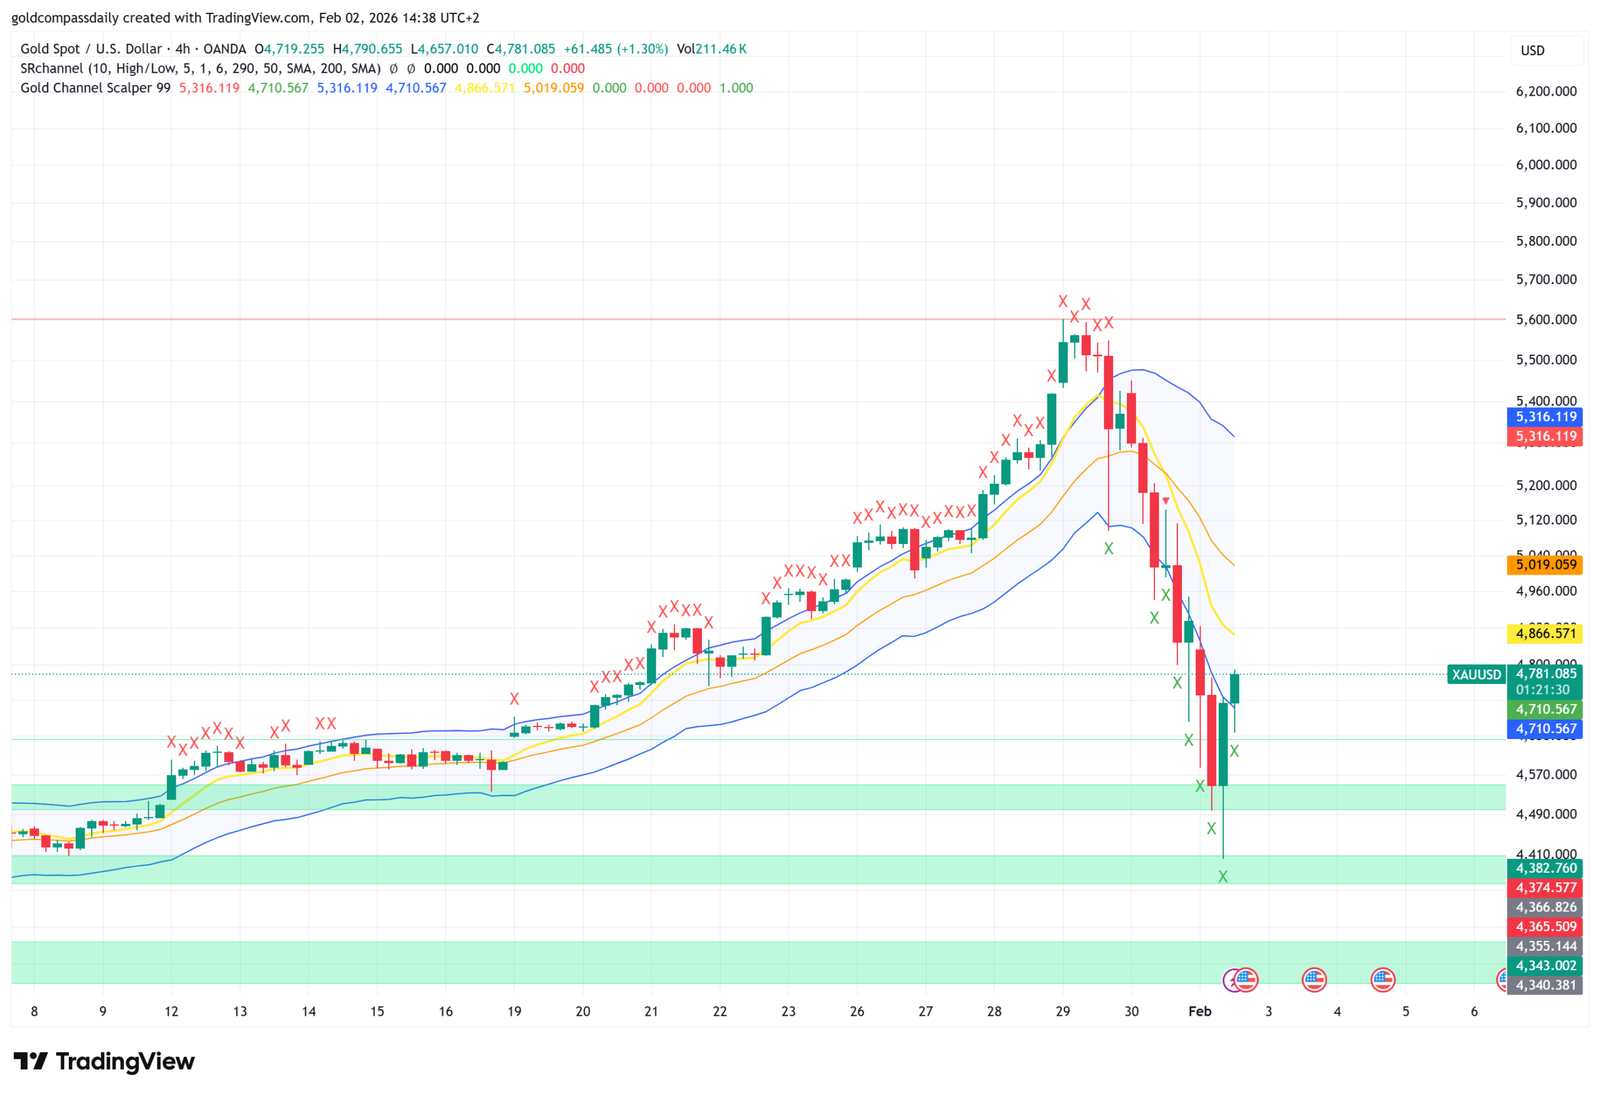
Looking at the higher timeframe, our Gold 4H chart analysis reveals a textbook “blow-off top” pattern. The parabolic move that characterized the end of January met a brick wall of institutional selling pressure. The vertical drop that followed wasn’t just a correction; it was a full-scale deleveraging event. The 4-hour candles show consecutive red bars with almost no lower wicks, indicating that the bears were in absolute control until the price hit the $4,650 – $4,710 demand zone.
Currently, XAU/USD is trading at $4,781, attempting to reclaim some of the lost territory. However, the moving average ribbons on the 4H chart have flipped from support to heavy resistance. The price is currently pinned below the 200-period SMA (yellow line), which is acting as a dynamic ceiling for any recovery attempt. Until we see a sustained 4H candle close above $5,019, the path of least resistance remains tilted to the downside.
Support Zones: The Green Bastion at $4,600
One of the most critical aspects of this Gold 4H chart analysis is the cluster of support levels highlighted in green. The market found significant buying interest between $4,657 and $4,710. This area represents a historical consolidation zone from mid-January, and its role as “polarity support” is being tested right now. If the daily close stays above $4,750, we might see a relief rally toward the $4,900 level.
However, the volume profile suggests that the bulk of the “long” positions are still trapped at much higher levels ($5,200+). These “trapped bulls” will likely use any minor bounce to exit their positions at break-even, creating further selling pressure. This is a classic “Sell the Rip” environment that requires extreme caution from retail traders.
Volatility Drivers: Fed Policy and the US Dollar
No Gold 4H chart analysis is complete without considering the macro catalysts. The underlying strength of the US Dollar Index (DXY) is the primary driver behind this gold carnage. With the market pricing in a more hawkish Federal Reserve under the potential leadership of Kevin Warsh, non-yielding assets like gold are losing their luster. Treasury yields are spiking, providing a legitimate alternative for “safe haven” capital.
The upcoming manufacturing and services data will be the final judge for today’s price action. If the data comes in stronger than expected, we could see a final flush-out that takes gold down to the next support tier at $4,380. Conversely, a weak data set could provide the spark needed for a short-squeeze back toward the $5,000 mark.
Technical Indicators: RSI and Moving Averages
The 4-hour Relative Strength Index (RSI) is currently clawing its way back from oversold conditions (sub-30 levels). While this suggests that the immediate selling pressure might be exhausted, it does not guarantee a trend reversal. In a strong downtrend, the RSI often oscillates between 20 and 50 without ever reaching the “overbought” zone.
The SMA 50 and SMA 200 on the Gold 4H chart analysis are now trending downward, confirming the bearish crossover. This “Death Cross” on the 4H timeframe is a lagging indicator but serves as a warning for long-term holders that the parabolic phase of the gold bull market is officially over for now. Risk management must be the top priority.
Conclusion: Strategic Outlook for the Remainder of the Week
To summarize this Gold 4H chart analysis, the market is in a fragile state of equilibrium. The crash has halted at major support, but the bounce lacks the conviction needed for a full recovery. Traders should watch the $4,710 level with hawkish intensity; a breach of this level on a 4H basis opens the trapdoor to significantly lower prices.
For those looking for long opportunities, wait for a confirmed higher low on the 1H timeframe or a reclaim of the $5,000 level. For the bears, any retest of the $4,900 – $5,000 zone that shows signs of rejection is a potential entry for a continuation play. Stay disciplined, use hard stop-losses, and keep an eye on the DXY!

Written by T. S. Gospodinov
T. S. Gospodinov is an Independent gold market analyst focused on liquidity structures and macro-driven price cycles.