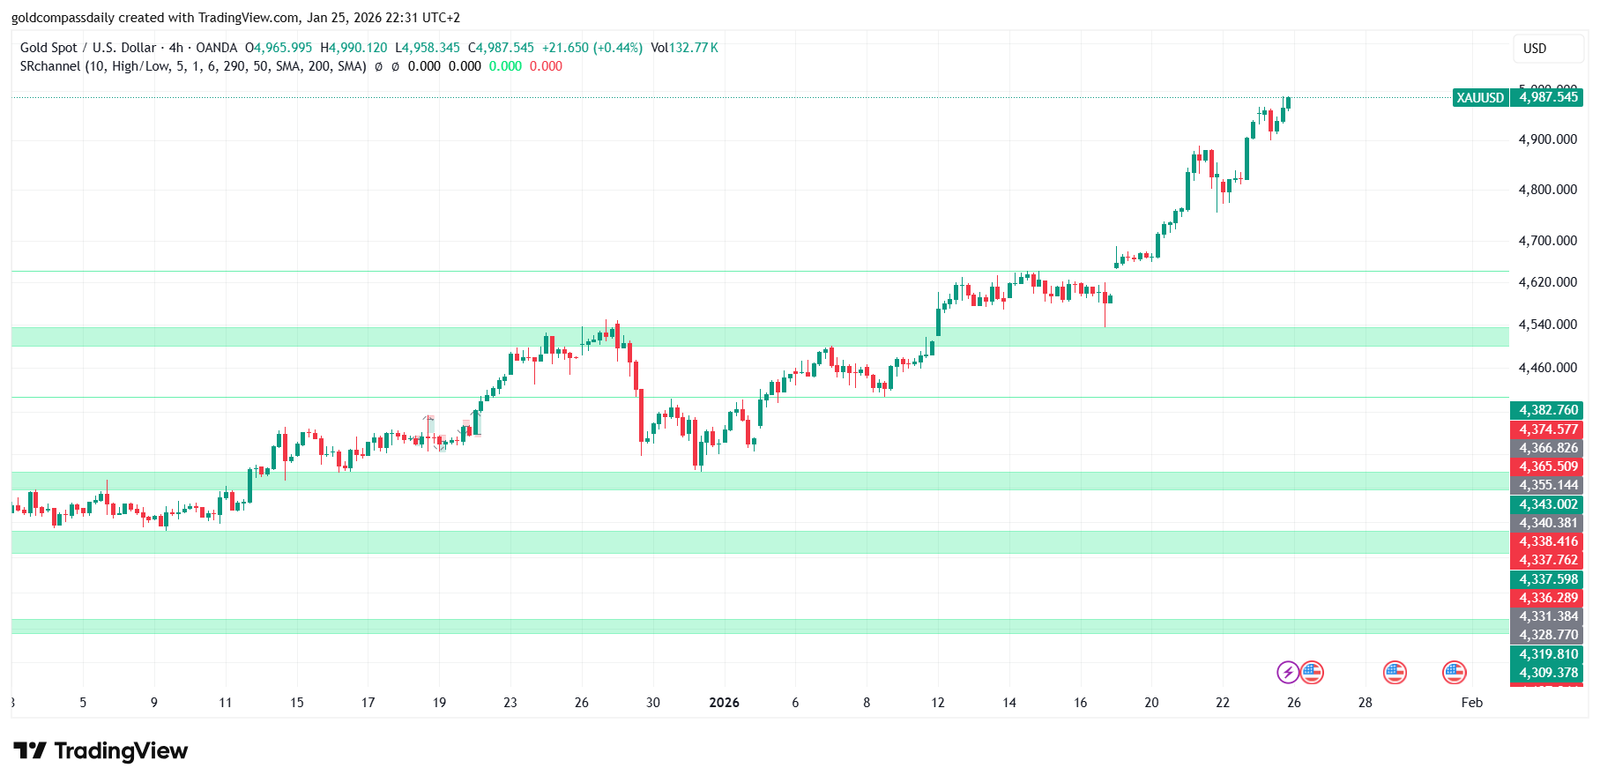
On the High-Timeframe (4H), Gold (XAU/USD) displays one of the cleanest bullish expansions of the year. Following a period of consolidation in early January, the market has successfully flipped previous supply zones into rock-solid demand floors, signaling that large-scale institutional buyers are still firmly in control.
HTF Structure – Higher Highs and Higher Lows
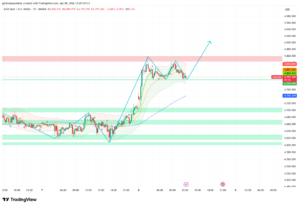
The 4-hour chart reveals a textbook market structure. The aggressive breakout above the $4,620 pivot was the primary catalyst that shifted the monthly sentiment to “Ultra-Bullish”. Since then, every minor correction has been met with significant buying pressure within our identified Gold Liquidity belts.
- Major Resistance: $4,990 – $5,000 (The Psychological Ceiling)
- Current Trading Range: $4,800 – $4,987
Key Accumulation Belts (The Green Zones)
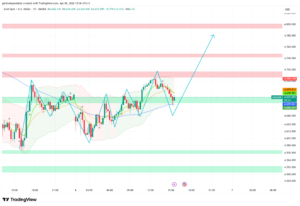
Our Order Flow analysis on the 4H timeframe highlights three critical zones where volume remains trapped, acting as magnets for future price action:
- Tier 1 Support ($4,620 – $4,650): The origin of the current expansion. This is the “ultimate floor” for the month.
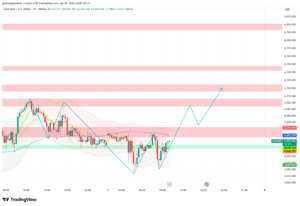
- Tier 2 Support ($4,480 – $4,540): A massive consolidation zone that absorbed late sellers before the mid-month rally.
- Tier 3 Support ($4,300 – $4,380): The historical base of the January trend.
Macro Target – The $5,000 Liquidity Hunt
As price approaches the $5,000 mark, we expect an increase in volatility. The Macro Edge suggests that this level isn’t just a number, but a massive target for Buy-Side Liquidity (BSL). Institutions are likely to push price into this “Kill Zone” to trigger retail FOMO before seeking a deeper retracement to rebalance the 4H price gaps.
Strategic Outlook: On the 4H chart, the trend is your friend. Avoid counter-trend shorting until a clear Break of Structure (BOS) occurs below the $4,800 level.

Written by T. S. Gospodinov
T. S. Gospodinov is an Independent gold market analyst focused on liquidity structures and macro-driven price cycles.