
Gold’s Bullish Resilience: Technical Breakout Targets $5,300
The gold market (XAU/USD) continues its aggressive ascent during the February 23 session, exhibiting a classic bullish trend structure characterized by higher highs and higher lows. After a brief consolidation phase earlier in the day, the price action has regained significant upward velocity, moving firmly away from the mid-day stabilization zone. Current market dynamics suggest that institutional demand remains robust, pushing the metal toward psychological and technical milestones.
Technical Structure and Key Levels
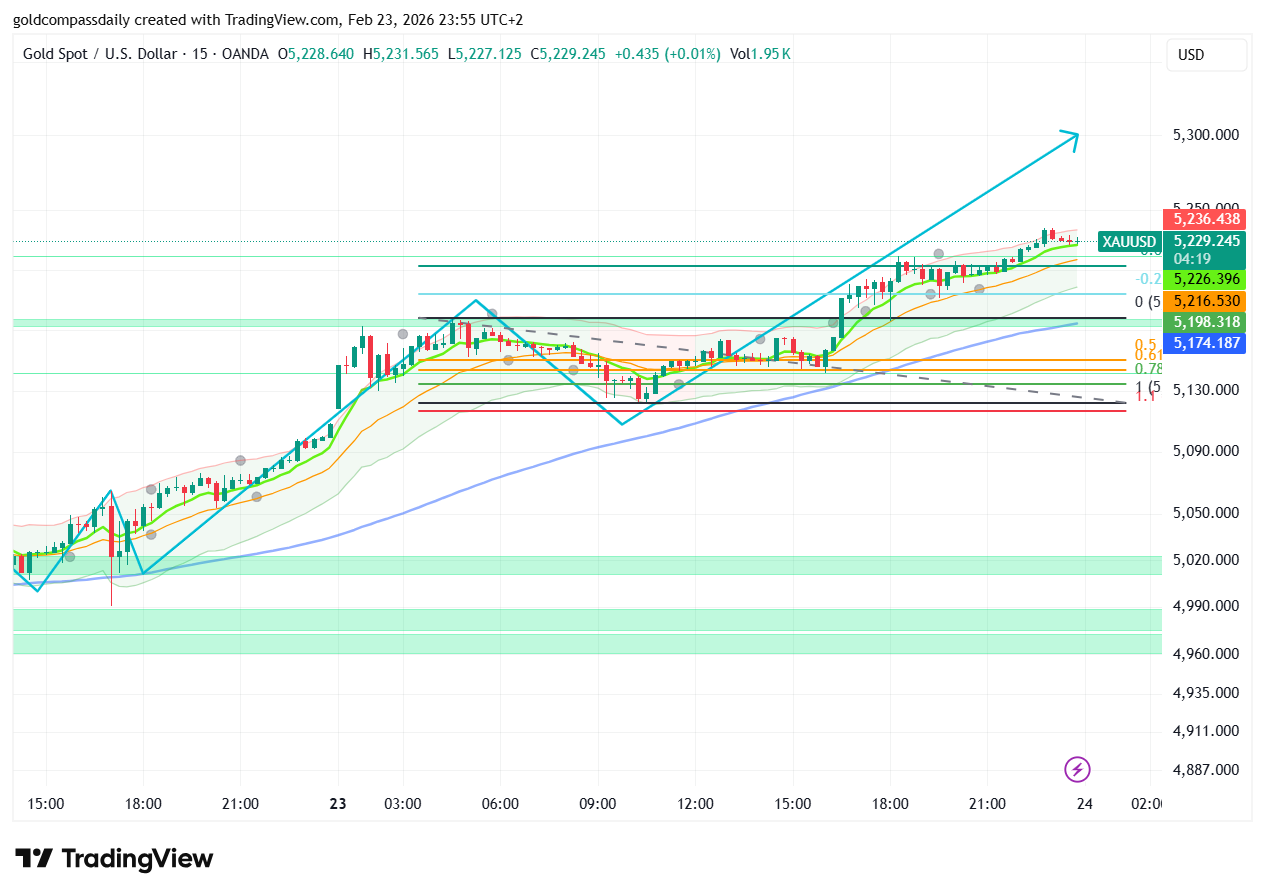
Looking at the 15-minute chart, gold has successfully navigated through several critical Fibonacci retracement levels. The recent price action saw a decisive bounce near the $5,130 support area, which has now established itself as a formidable floor for the current trend. Following this recovery, XAU/USD cleared the $5,200 handle with ease, signaling that the bulls have full control of the immediate timeframe.
As of the latest data, the price is trading near $5,229.245, testing the upper boundaries of the current ascending channel. Several key technical observations support the continuation toward $5,300:
- Ascending Channel Integrity: The price remains well-supported by the 20-period and 50-period moving averages, which are currently sloping upward in parallel, confirming strong trend momentum.
- Fibonacci Confluence: The current trajectory is eyeing the -0.27 and -0.618 extension levels. The move toward $5,300 aligns with the broader extension of the recent swing low-to-high projection.
- Resistance Clusters: While minor intraday resistance is noted at $5,236.438, a sustained break above this level leaves a clear path with minimal technical friction until the $5,300 psychological barrier.
Price Action Dynamics
The candlestick patterns over the last few hours indicate a “buy the dip” mentality among market participants. Every minor retracement has been met with aggressive liquidity absorption, preventing any deep corrections. The Relative Strength Index (RSI) and other momentum oscillators are trending in the upper quadrants; while approaching overbought territory, they suggest that the trend has sufficient “fuel” for one more decisive leg up before a meaningful exhaustion phase occurs.
If the current momentum sustains, the $5,300 target is not just a psychological number but a technical necessity to complete the current bullish cycle. Traders should monitor the $5,226.396 level closely; as long as the price holds above this immediate pivot, the bullish thesis remains the dominant market narrative.
Macro Drivers and Sentiment
The underlying strength in gold is further bolstered by recent shifts in global trade policy and heightened geopolitical uncertainty. With new tariff announcements and volatility in the currency markets, investors are rotating back into physical and paper gold as a primary hedge. This “flight to safety” combined with the technical breakout creates a high-probability environment for the projected move to $5,300 within the next few trading hours.
Disclaimer: This analysis is for informational purposes only and does not constitute financial advice. Trading gold involves significant risk.

Written by T. S. Gospodinov
T. S. Gospodinov is an Independent gold market analyst focused on liquidity structures and macro-driven price cycles.


