Gold is navigating one of the most politically charged trading days of the year. After rallying to $4,800 in Wednesday’s session — confirming the recovery from the $4,100 post-FOMC low — XAU/USD reversed sharply following early morning comments from President Trump that previewed sweeping new tariff measures. Price dropped to $4,558 before stabilising at the current level of $4,583. The 15-minute chart projects one more dip to the $4,515–$4,524 green demand zone before a recovery back toward $4,665 — but today is not a day where technical levels drive price action. Today, President Trump speaks at the White House this evening to announce what his administration has called “Liberation Day” — a comprehensive restructuring of US trade policy that could reshape global markets for months.
The Chart: Tariff-Driven Drop, Technical Support Below
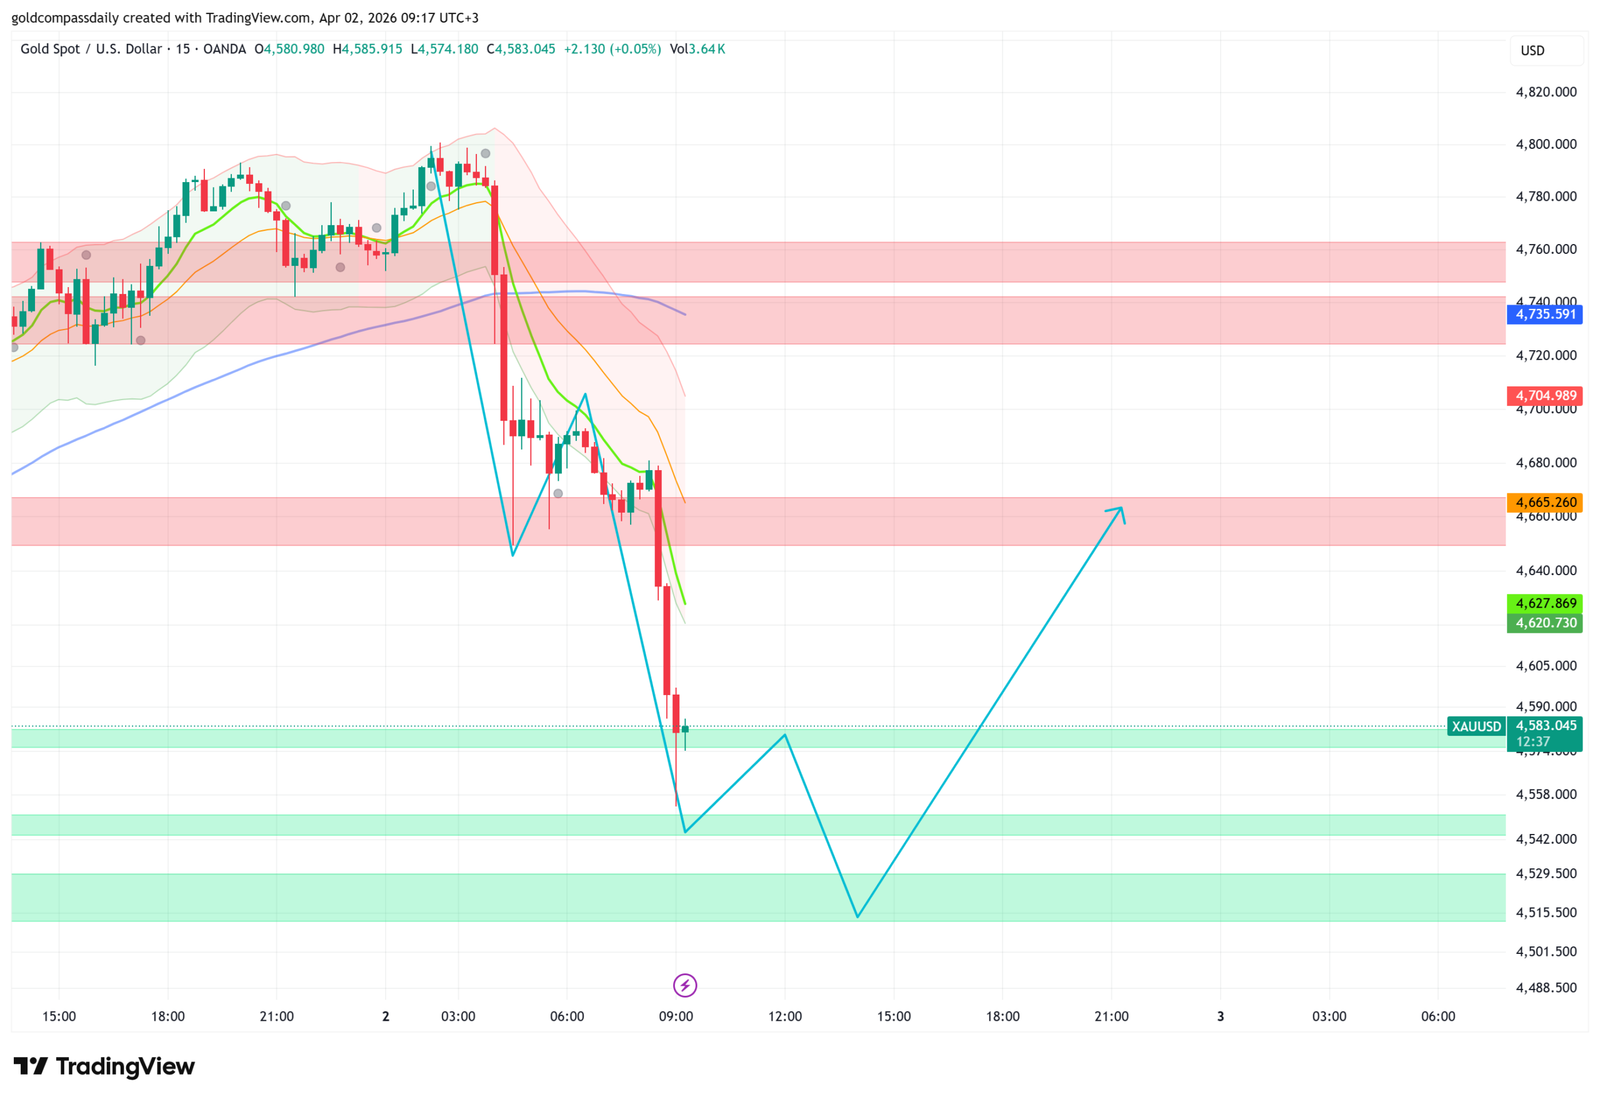
The structure of the recovery from $4,100 absorbed a significant blow overnight. The move from $4,800 to $4,558 — a $242 decline in under four hours — was driven entirely by geopolitical news flow rather than technical breakdown, which is an important distinction. The green demand zones that defined the recovery all week remain intact below current price: $4,542–$4,558 at current levels, and the deeper zone at $4,515–$4,529 as the projected dip target on the chart.
The 15-minute chart shows price attempting to stabilise after the initial Trump-driven selloff. Moving averages have rolled over sharply but are beginning to flatten — a sign that the immediate selling impulse is losing momentum. The Bollinger Bands have expanded dramatically to the downside, which in isolation is bearish, but the proximity to the green demand zone suggests buyers are likely to emerge in the $4,515–$4,524 area.
The projected path shows a zig-zag: a dip into the $4,515–$4,524 zone, a hold, and then a recovery toward $4,665.260 — the orange resistance level visible on the chart and the lower boundary of the pink resistance band that was broken in yesterday’s rally. A close above $4,665 would signal that the tariff-driven dip has been fully absorbed and the recovery is back on track.
The invalidation level is a close below $4,488 — the lower boundary of the green demand zone. Below that level, the tariff shock has done structural damage and the $4,422–$4,440 area comes back into focus.
Liberation Day: What Trump Is Expected to Announce
Today is the day the Trump administration has designated for the announcement of comprehensive new US tariff measures — what the White House has been calling “Liberation Day.” The measures are expected to include broad reciprocal tariffs on imports from multiple trading partners, with rates potentially ranging from 10% to 25% depending on the country and sector. The announcement follows months of targeted tariff actions and signals a shift to a more systematic approach to US trade policy.
For gold, the tariff announcement is a two-sided event. In the near term, tariff escalation strengthens the dollar as a safe-haven currency and creates headwinds for gold through the USD channel. That is what happened overnight when Trump’s preliminary comments drove the initial $242 selloff. However, the medium-term implications are more nuanced: tariffs raise domestic inflation (gold hedge), increase global trade uncertainty (safe-haven demand), and risk a retaliatory spiral that slows global growth (risk-off gold buying). Historically, significant trade policy escalation has been net positive for gold over a 4–8 week horizon even when the initial reaction is negative.
The specific details matter enormously. A 10% blanket tariff on all imports is a known risk — largely priced in after months of signals. A 25% tariff on European goods or a comprehensive China package would be a significant escalation beyond current market pricing and would likely trigger sharp moves across all asset classes. The EUR/USD, AUD/USD, and commodity currencies (CAD, NZD) face the most direct tariff risk.
Already Published: Australian Trade Balance Beats
Australia’s Goods Trade Balance printed at $5.69B — significantly above the forecast of $2.81B and the prior $2.26B. That is a dramatic improvement in Australia’s trade surplus, driven by strong commodity export prices (commodity prices y/y were +12.8% yesterday). The AUD beat is notable but overshadowed entirely by tariff risk — any Trump announcement targeting Australian exports or a broad China-focused measure that hurts Chinese demand for Australian commodities would reverse the AUD positive quickly.
Japan’s Monetary Base y/y at -11.6% (forecast -10.8%, prior -10.6%) shows the BOJ continuing to reduce its balance sheet — part of the ongoing monetary normalisation process. The 10-year Japanese Bond Auction at 6:35am showed a yield of 2.35% against the prior 2.12% — yields rising, consistent with the BOJ’s gradual exit from ultra-loose policy. Yen is mildly supported by rising domestic yields.
9:30am — Swiss CPI: Inflation Signal
Swiss CPI m/m is forecast at 0.5% (prior 0.6%) — a slight deceleration in Swiss monthly inflation. Switzerland’s inflation has been among the lowest in the developed world, which is why the SNB was first to cut rates in this cycle. A reading in line with 0.5% confirms the low-inflation environment that gives the SNB flexibility. A significant upside surprise (above 0.8%) would be a CHF-positive event and could prompt reassessment of SNB rate expectations.
USD/CHF impact: Swiss franc is a safe-haven currency that typically strengthens on global trade uncertainty. Today’s tariff announcement is the primary driver for the pair — a broad, aggressive tariff package from Trump would strengthen the franc and push USD/CHF lower. A limited or market-friendly announcement would have the opposite effect.
11:00am — ECB Economic Bulletin: Forward Guidance Check
The ECB Economic Bulletin at 11:00am is a comprehensive quarterly publication that covers the ECB’s assessment of the Eurozone economy, inflation outlook, and monetary policy stance. Published two weeks after each rate decision, it provides detailed analysis and forward guidance that can move EUR/USD if it deviates from Lagarde’s press conference messaging.
The key sections to watch are the inflation assessment (following the 2.6% CPI Flash from yesterday — above the 1.9% prior but in line with forecast), the growth outlook (given this week’s mixed PMI data), and any language around the pace of future rate cuts. If the bulletin is more hawkish than Lagarde’s recent tone, EUR/USD gets a lift. If it’s more dovish, the pair faces additional pressure ahead of the tariff announcement.
EUR/USD: The ECB Bulletin sets the European session tone. But the Trump tariff announcement this evening is the dominant driver for the week — the bulletin’s impact will be secondary unless it contains a dramatic policy shift.
2:30pm — Challenger Job Cuts: Early Warning Signal
Challenger Job Cuts y/y is expected to show a significant decline from the prior reading of -71.9%. This measures announced corporate layoffs — a forward-looking labour market indicator. A reading that shows job cuts accelerating (less negative or positive) would be an early warning of labour market deterioration and would add to the case for Fed cuts ahead of tomorrow’s NFP. A continued decline in job cuts confirms that corporate America is still not in layoff mode despite slowing growth.
3:30pm — US Unemployment Claims and Trade Balance: The Pre-NFP Double
Weekly Unemployment Claims are forecast at 212K (prior 210K) — essentially unchanged, signalling continued labour market resilience. This is the final pre-NFP employment signal before tomorrow’s official payrolls report. A reading above 225K would be a meaningful deterioration and could force a dovish reassessment of the Fed’s stance heading into the NFP. A reading below 205K confirms the labour market is holding firm.
US Trade Balance is forecast at -$60.5B (prior -$54.5B) — a significant widening of the US trade deficit. Ironically, an expanding trade deficit is one of the primary justifications the Trump administration cites for its tariff policy. A deficit wider than -$60.5B would reinforce the political case for aggressive tariff action and could be referenced directly in today’s Liberation Day announcement.
Gold: Weak claims + wide trade deficit = dollar under modest pressure = mild gold support heading into the tariff announcement. The claims number is the more market-sensitive of the two — watch for the reaction at 3:30pm as a preview of how markets will position ahead of the evening’s main event.
The Liberation Day Sequence: What to Watch and When
The Trump tariff announcement is expected in the early US evening — after European markets close but while US markets are still open. The sequence of events and market reactions will unfold in real time, but several principles apply regardless of the specific measures announced:
Currencies most at risk: EUR/USD (European goods tariffs), AUD/USD and NZD/USD (China-adjacent commodity currencies), CAD/USD (potential automotive and energy tariffs), CNY (direct China measures). Safe-haven currencies — JPY, CHF — benefit from escalation.
Equity markets: S&P 500 and Nasdaq face the most acute risk from broad tariffs — import-dependent sectors (technology hardware, consumer electronics, retail) face margin compression. Export-oriented US industrials and defence contractors benefit. European equities (DAX, CAC) face a dual hit from both the direct tariff impact and EUR weakness.
Gold’s dual nature today: The initial reaction to aggressive tariffs may be dollar-positive and gold-negative — that is what happened at 4:00am when Trump’s preliminary comments drove the $242 selloff. But if the measures are broader and more severe than expected, the second-order effect — global growth slowdown, increased safe-haven demand, inflationary pressure from higher import prices — is structurally bullish for gold over the following weeks. The dip to $4,515 today may be the entry point that April’s gold buyers are looking for.
Key Levels and Full Market Summary
- Gold (XAU/USD): $4,583 · Dip target $4,515–$4,524 · Recovery target $4,665 · Invalidation below $4,488 · Liberation Day announcement = primary driver tonight
- EUR/USD: ECB Bulletin at 11:00am sets European tone · Tariff announcement drives the close · 25% EU tariff = sharp break below 1.07 · Limited tariff = EUR recovers from recent lows
- AUD/USD: Trade balance beat is positive but overshadowed · China tariff risk is the primary concern · Bank holiday today (AUD) = thin liquidity
- USD/JPY: Rising JGB yields support yen · Safe-haven yen demand on tariff escalation · Claims at 3:30pm + tariff announcement drive the pair
- USD/CHF: Swiss franc safe-haven · Tariff escalation = CHF strengthens · Swiss CPI at 9:30am is the domestic input
- S&P 500: Tariff breadth and severity determine the equity reaction · Tech and consumer discretionary most exposed · Defence and domestic industrials benefit
- US Treasury yields: Aggressive tariffs = inflation concern = yields rise · But growth slowdown fear = yields fall · Net: flattening of the curve, with short-end sensitive to claims data
- WTI Crude: Trade war escalation = global demand slowdown concern = oil under pressure · Natural Gas Storage at 5:30pm (+38B forecast vs -54B prior) = large expected build = gas prices fall
- Gold medium-term: Tariff escalation is net positive over 4–8 weeks via inflation hedge and safe-haven demand · Initial dip to $4,515 is the technical setup · Recovery toward $4,665 and then $4,800 is the April roadmap if today’s dip holds
Gold has navigated a remarkable month. From the $4,100 post-FOMC low to $4,800 in eight sessions, the metal recovered faster than almost any analyst projected. Today’s tariff shock introduces new volatility — but the fundamental case for gold in a world of escalating trade tensions, slowing growth, and rising prices is stronger now than it was before Liberation Day. The dip to $4,515 is the level to watch. Hold it, and April’s gold story is just beginning.
Analysis based on the XAU/USD 15-minute chart as of April 2, 2026, 09:17 UTC+3. Economic data sourced from the daily macro calendar. This article is for informational and educational purposes only and does not constitute financial advice.

Written by T. S. Gospodinov
T. S. Gospodinov is an Independent gold market analyst focused on liquidity structures and macro-driven price cycles.