Gold Market Liquidity: The “Super Thursday” Shakeout
Gold (XAU/USD) has just sent a shockwave through the financial world. In a matter of hours, the precious metal plummeted from its $5,000 stronghold, diving toward the $4,830 support zone. For the general public, this move looks like a sudden collapse, but seasoned observers recognize it as a classic Gold Market Liquidity flush. This strategic “dump” is often designed to clear out retail stop-losses before major institutions enter the fray.
As we head into February 5, 2026, the market is bracing for a “Super Thursday.” With interest rate decisions from the Bank of England and the European Central Bank, followed by critical US labor data, the current volatility is the precursor to a massive directional shift.
Technical Breakdown: The 1-Hour Chart Trap
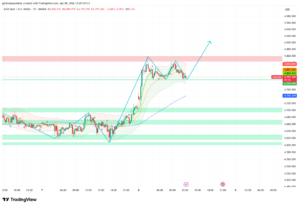
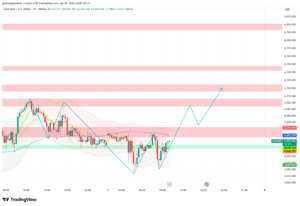
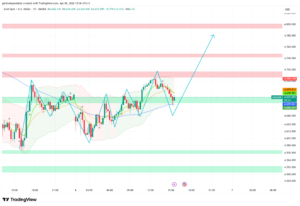
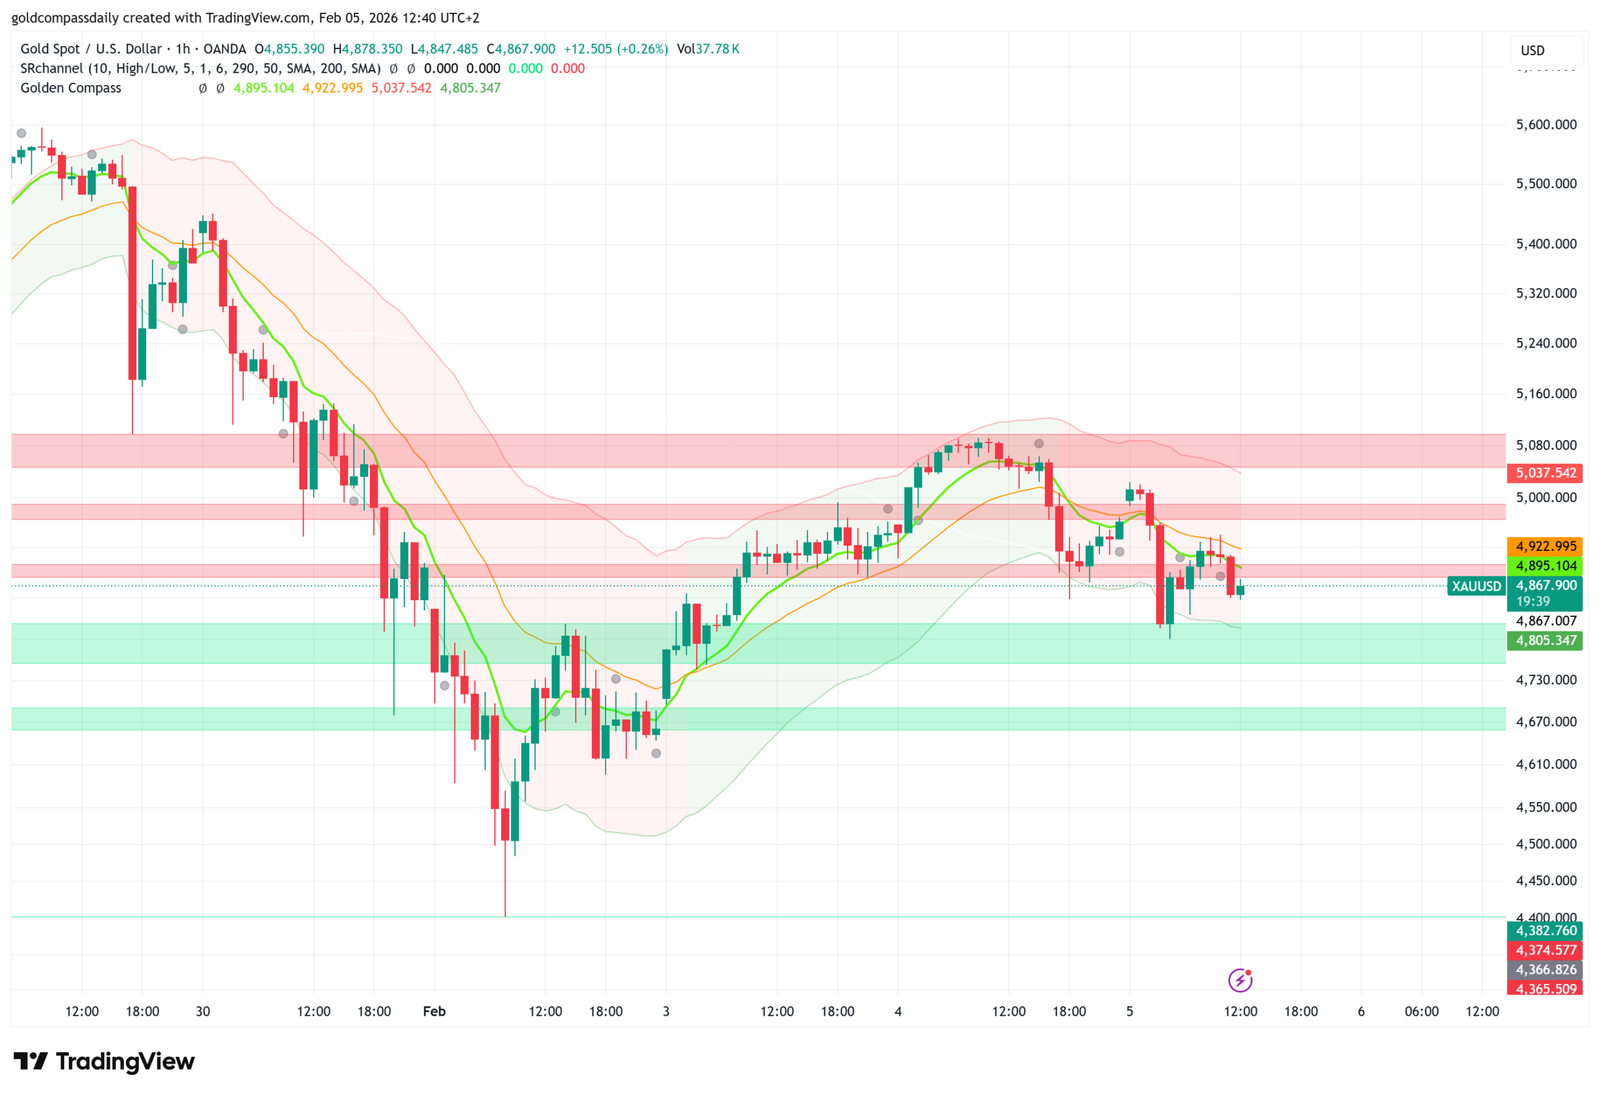
Analyzing the 1-hour timeframe reveals a textbook “Stop Run.” After consolidating near $4,980, gold hit a wall of selling pressure that sent it spiraling. However, the charts show that this move is hitting a massive “Value Zone” where long-term buyers typically wait.
- The Support Floor ($4,830 – $4,860): This is the current line in the sand. If gold can close an hourly candle back above $4,880, the Gold Market Liquidity hunt may be over, signaling a rapid recovery.
- The Resistance Ceiling ($4,941): This level must be reclaimed to prove the bears have lost control. Until then, any bounce is technically a “relief rally.”
- Oversold Signals: On the 1-hour scale, gold is currently “screaming” for a correction. When prices drop this fast without fundamental change, they often snap back just as quickly.
Why Central Banks are Moving the Needle Today
Why is Gold Market Liquidity so thin today? The answer lies with the world’s central banks. The Bank of England (BoE) is expected to hold rates at 3.75%, but any hint of a “dovish” pivot could send gold skyrocketing back toward $5,100. Similarly, the ECB’s stance on inflation will dictate the Euro’s strength, which indirectly moves the price of gold.
For the general public, it’s important to understand that gold isn’t just a metal; it’s a global currency hedge. When central banks speak, the “Big Money” moves first, often creating the wild price swings we are seeing right now.
The US Jobless Claims Catalyst
Later today, the US labor market data will hit the wires. Forecasts suggest initial jobless claims will settle around 212K. If the numbers come in higher, indicating a cooling economy, we expect Gold Market Liquidity to surge as investors rush back into safe-haven assets. Conversely, a strong jobs report could provide the fuel for a final push down toward $4,680 before the long-term J.P. Morgan forecast of $6,300 takes hold.
Levels to Watch for the Next 6 Hours:
1. **The Bounce:** Watch for high-volume buying at $4,840.
2. **The Breakdown:** A sustained hold below $4,800 could trigger a “margin call” cascade, taking us deeper into the $4,500 range.
Conclusion: Strategic Patience is Key
The Gold Market Today is in a state of high-alert. We have moved from a steady uptrend into a “discovery phase” where the market is trying to find its new floor. While the 1-hour chart looks intimidating, it provides the most precise entries for those with a disciplined strategy. Stay patient, watch the support zones, and don’t let the “noise” of the crash cloud your long-term vision of gold’s 2026 trajectory.

Written by T. S. Gospodinov
T. S. Gospodinov is an Independent gold market analyst focused on liquidity structures and macro-driven price cycles.