
Gold Market Neutrality: Price Action Sustains Sideways Channel
The gold market (XAU/USD) is starting the final trading day of the week in a state of equilibrium. Following the volatility seen in previous sessions, the metal has transitioned into a well-defined consolidation phase. As we approach the London and New York sessions for February 27, the price action remains confined within a horizontal range, reflecting a temporary standoff between buyers and sellers and a lack of immediate directional conviction.
Navigating the Neutral Zone: Key Technical Levels
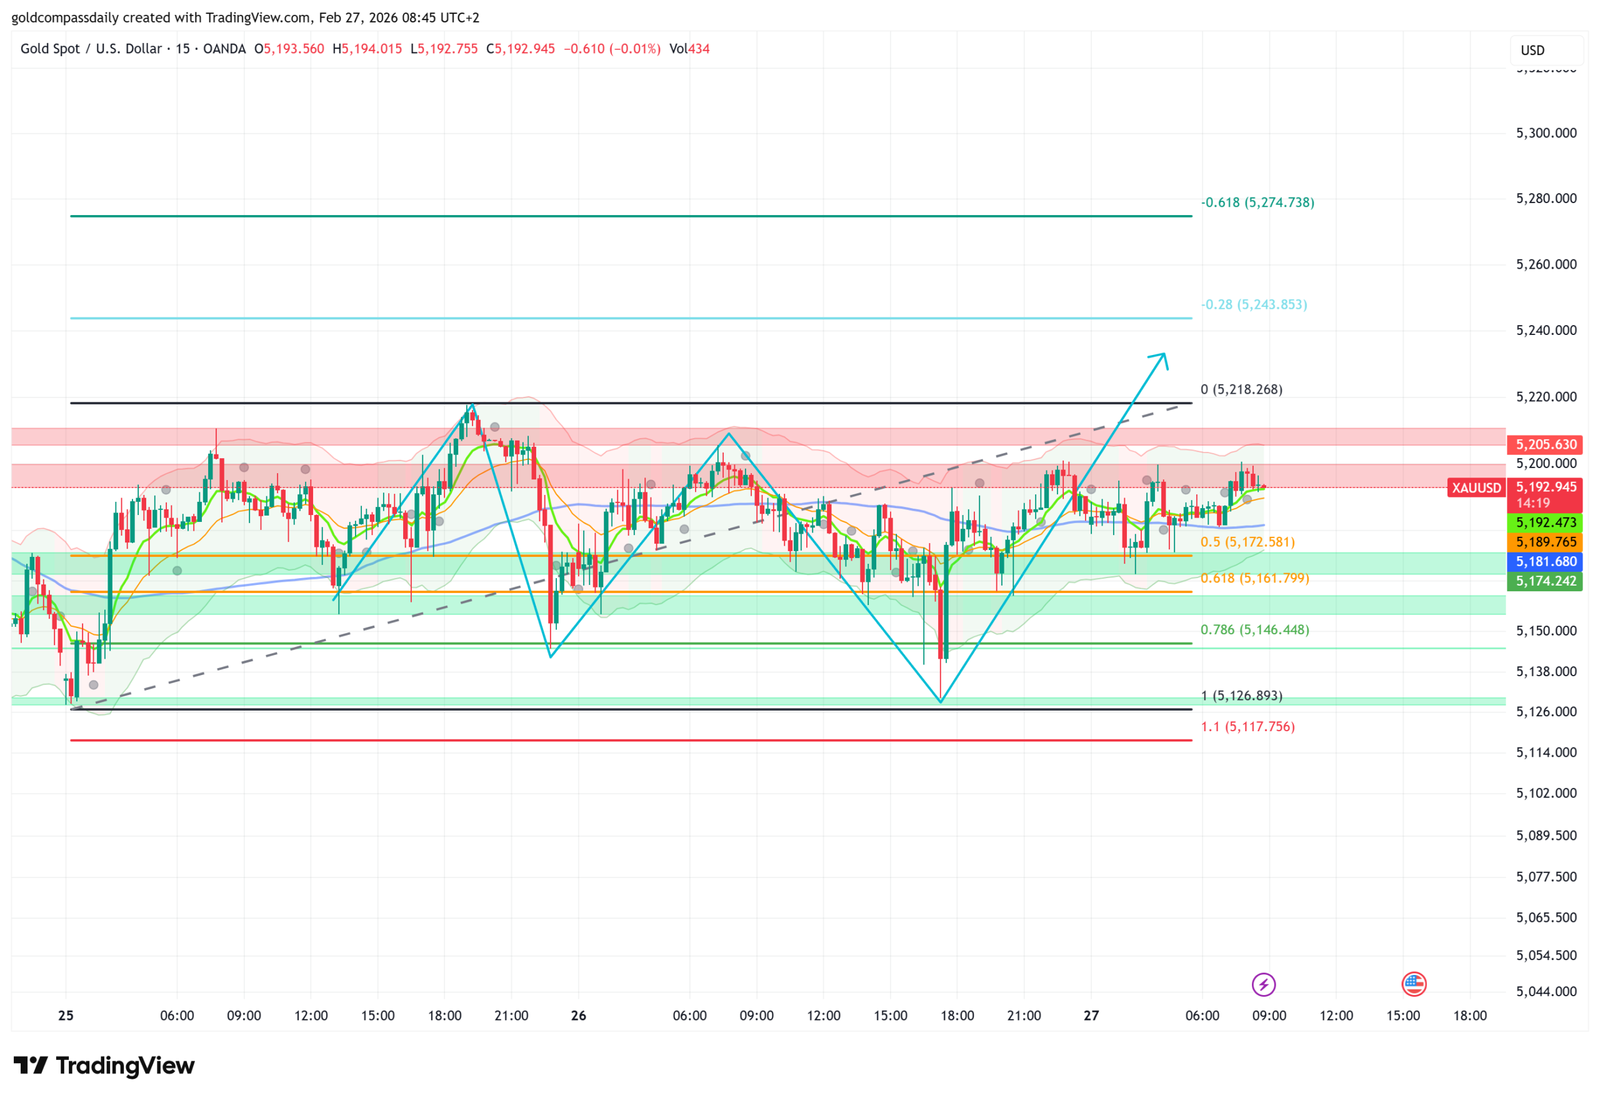
Current observations on the 15-minute chart indicate that XAU/USD is trading at $5,192.945. The price is currently oscillating around the median of its recent structure, showing a classic “mean reversion” behavior. Unlike the trending markets of earlier this week, the current setup is strictly range-bound, respecting the following boundaries:
- Immediate Resistance Cluster: The upper boundary of this consolidation is marked by the $5,200 psychological level and the recent pivot high at $5,218.268. Until a decisive breakout occurs here, the upside remains capped.
- Fibonacci Support Base: On the downside, the price is consistently finding buyers near the 0.5 Fibonacci level at $5,172.581 and the 0.618 “Golden Pocket” at $5,161.799. These levels are acting as a solid floor for the current sideways movement.
- Consolidation Pivot: The $5,189.765 level has emerged as a high-volume pivot point where the price continues to magnetize, indicating a lack of trend momentum.
Market Structure and Sentiment
The technical geometry shows a series of overlapping waves, which is the hallmark of a non-trending market. The ascending trend line that supported the price earlier in the week has flattened, and the moving averages are now moving in parallel, further confirming the neutral bias. The Relative Strength Index (RSI) is hovering near the 50 mark, suggesting that neither bulls nor bears have gained the upper hand at this stage.
Strategic Outlook for the Session
In a sideways channel of this nature, the most prudent approach is to wait for a confirmed expansion of the range. A breakout above $5,218 would be required to resume the path toward $5,300, while a sustained break below $5,161 could signal a deeper corrective phase toward the 1.0 Fibonacci extension at $5,126.893.
As we head into the high-liquidity hours of the New York open, traders should be prepared for potential “fake-outs” at the edges of the channel. The market is effectively in a “wait-and-see” mode, likely anticipating the next major macroeconomic catalyst to define the trend for the beginning of March.
Disclaimer: This analysis is for informational purposes only and does not constitute financial advice. Trading gold involves significant risk.

Written by T. S. Gospodinov
T. S. Gospodinov is an Independent gold market analyst focused on liquidity structures and macro-driven price cycles.


