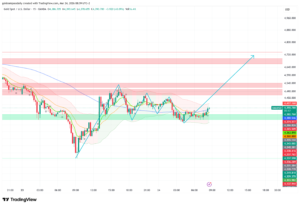
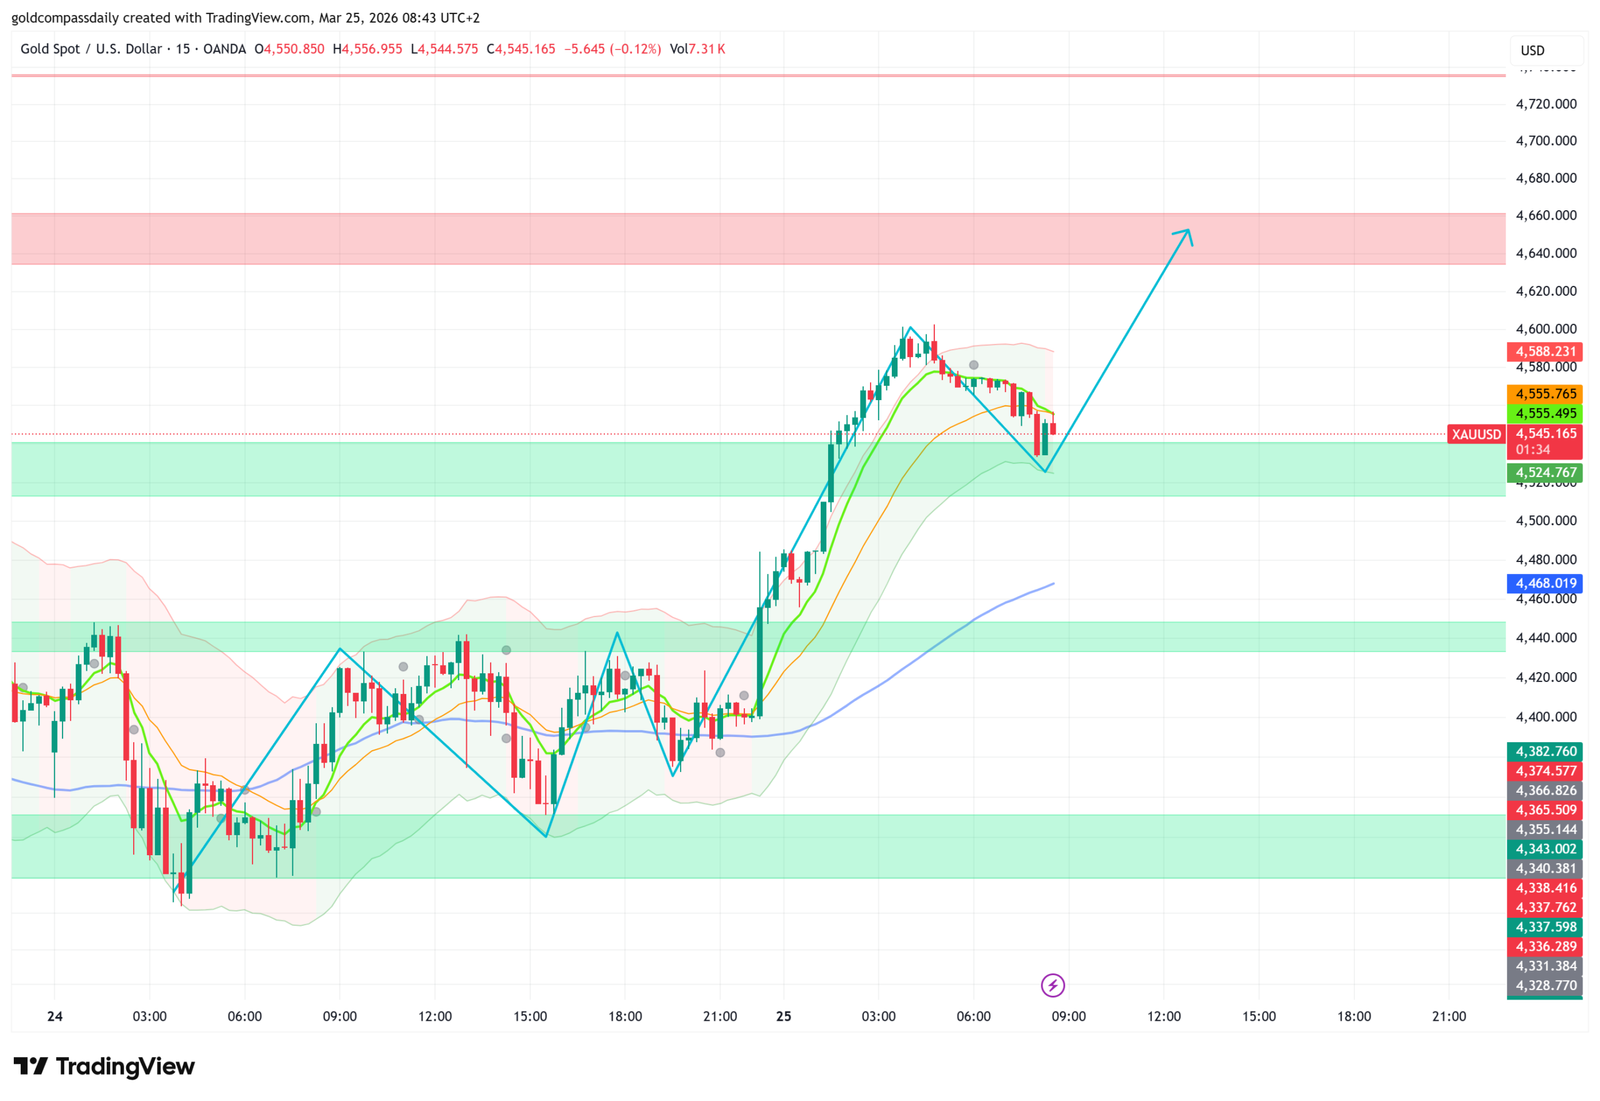
Gold is consolidating above $4,540 this Wednesday morning after one of its sharpest single-session recoveries since the post-FOMC collapse began. XAU/USD surged from $4,390 to a high of $4,588.231 during Tuesday’s session — a $200 move driven by weaker-than-expected US PMI data that forced markets to revisit the Fed’s hawkish narrative — and is now digesting those gains in a tight range between $4,524.767 and $4,556. The 15-minute chart shows the consolidation is building toward a continuation, with the projected move targeting $4,660 — the lower boundary of the next pink resistance band.
Today’s calendar is more substantive than yesterday’s PMI sweep. UK inflation data at 9:00am, ECB President Lagarde at 10:45am, German ifo Business Climate at 11:00am, and US Import Prices at 2:30pm provide a sequence of inputs that will either accelerate gold’s recovery or create another consolidation ceiling before the next leg higher.
The Chart: Consolidation Complete, Next Leg Approaching
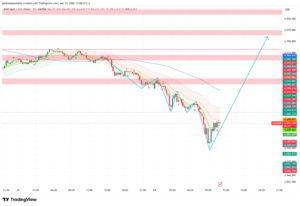
The structure on the 15-minute chart has shifted decisively since Monday’s $4,100 low. Price has made a series of higher lows — $4,100, then $4,340, then $4,392 on Tuesday morning, and now holding above $4,524.767 in the green demand zone. Each pullback has been shallower than the last, a classic sign of strengthening bullish momentum.
The green demand zone between $4,524.767 and $4,440 is the current base. The moving averages on the 15-minute chart have crossed upward for the first time since the post-FOMC selloff began — a structural confirmation that the short-term trend has reversed. The Bollinger Bands are re-expanding to the upside after yesterday’s strong move, and price is holding above the midline.
The immediate resistance is $4,556–$4,588, where Tuesday’s rally stalled. A clean break and hold above $4,588.231 opens the path to the pink resistance band at $4,640–$4,660 — the primary target on the chart. Above that, $4,720 remains the broader recovery objective first identified on Monday.
The floor to hold is $4,524.767. A close below that level would indicate the consolidation is turning into a reversal rather than a continuation — and would bring the $4,468 area back into focus as the next support.
2:30am — Australian CPI: Disinflation Accelerating
Australia’s inflation data published overnight delivered a significant downside surprise. CPI m/m printed at 0.0% against a forecast of 0.1% and a prior of 0.4% — flat, no monthly price growth. CPI y/y came in at 3.7% versus a forecast of 3.8% and a prior of 3.8% — a modest annual deceleration. Most importantly, the Trimmed Mean CPI m/m — the RBA’s preferred inflation gauge — printed at 0.2% against a forecast of 0.3% and a prior of 0.3%.
This is a clean disinflation print. All three measures came in at or below forecast, and the Trimmed Mean deceleration tells the RBA that underlying price pressures are cooling faster than expected. Coming just days after the services PMI collapsed to 46.6, the RBA now has both a weakening economy and decelerating inflation — a combination that puts a rate cut firmly on the table at the May meeting.
AUD/USD impact: Bearish. The combination of weak services PMI and below-forecast inflation removes the last argument for RBA caution. The pair is under pressure and a break below recent lows becomes more likely. ASX 200 is modestly positive — rate cut expectations support equities, particularly rate-sensitive sectors like REITs and financials.
9:00am — UK CPI: The BOE’s Most Watched Number
The UK inflation release at 9:00am is the most significant European data point of the week for forex markets. CPI y/y is forecast to hold at 3.0% (prior 3.0%), and Core CPI y/y is also forecast unchanged at 3.1% (prior 3.1%). On the producer side, PPI Input m/m is forecast at 0.5% (prior 0.4%) and PPI Output m/m at 0.3% (prior 0.0%) — both showing mild acceleration in pipeline price pressures.
The headline and core readings holding at 3.0% and 3.1% respectively — both above the BOE’s 2% target — are the primary reason the BOE has been slower than the ECB to signal cuts. A reading in line with forecasts today would maintain the current cautious stance. A surprise to the downside — particularly a core CPI print below 3.0% — would significantly accelerate May cut pricing and weaken sterling. A surprise to the upside would remove May from the table and provide a brief GBP rally.
GBP/USD impact: This is the week’s most binary release for the pound. In line = no move. Miss = sharp GBP decline toward recent lows. Beat = GBP bounce, but limited by the broader dollar-strength trend.
UK gilts: Lower CPI = lower gilt yields (bond prices higher) = positive for rate-sensitive UK sectors. Higher CPI = yields spike, particularly at the short end.
Gold: UK CPI has limited direct impact on XAU/USD unless it triggers a significant USD move through GBP/USD volatility. Watch for any ripple effect through EUR/USD, which tends to move with GBP in European hours.
10:45am — ECB President Lagarde Speaks
Lagarde’s appearance at 10:45am is the most watched central bank communication of the day. After last Thursday’s ECB decision — which held rates at 2.15% and was accompanied by a dovish press conference — markets are pricing in further cuts from the ECB in 2026. Any confirmation or acceleration of that dovish signal today would add to EUR/USD downside.
The specific language to watch: any reference to the below-target Eurozone CPI (1.9%), any acknowledgement of the weak PMI readings from yesterday (particularly French and German manufacturing in contraction), and any forward guidance on the pace of future cuts. A phrase like “we have room to act” or “the disinflation process is well on track” would be interpreted as a green light for faster easing.
EUR/USD impact: Dovish Lagarde adds to downward pressure. The pair is testing key support — a hawkish surprise (unlikely given the data backdrop) would provide a meaningful relief rally. Net bias: more downside risk than upside at this speech.
Gold: A dovish Lagarde that weakens EUR/USD strengthens the dollar at the margin — a mild near-term headwind for gold as it approaches the $4,588 resistance. However, the broader context of a globally dovish central bank environment is structurally positive for the metal.
11:00am — German ifo Business Climate: Recovery or Relapse?
The German ifo Business Climate index is forecast at 86.2, down from the prior 88.6 — a significant expected deterioration. This follows yesterday’s German Flash Manufacturing PMI slipping back into contraction, and paints a consistent picture of a German economy that briefly stabilised earlier in the year but is now losing momentum again.
A reading below 85 would be alarming — it would confirm that the brief optimism seen in January and February was short-lived, and would give the ECB additional justification for accelerating its easing cycle. A beat above 88 would be a genuine surprise and could provide a brief EUR/USD recovery.
DAX impact: The ifo index is closely tracked by German equity investors. A beat supports the DAX through improved business confidence. A miss reinforces the bearish macro backdrop but may paradoxically support rate-sensitive DAX sectors through ECB cut expectations.
2:30pm — US Import Prices and Current Account
US Import Prices m/m at 2:30pm is forecast at 0.6%, a significant jump from the prior 0.2%. Import prices are a leading indicator of consumer inflation — if goods entering the US are getting more expensive, that feeds into CPI over the following months. A reading at or above 0.6% would be mildly hawkish for the Fed and supportive of the dollar.
The US Current Account is forecast at -$211B (prior -$226B) — a slight improvement in the external deficit. This is a quarterly data point and rarely moves markets on release, but the trend in the current account matters for long-term USD valuation.
Gold: A hot import prices print (above 0.6%) would be the primary risk to the current recovery momentum — it would reignite Fed hawkishness concerns and could push gold back toward the $4,524 support zone. A soft print (below 0.3%) would be the opposite, providing the next leg toward $4,588 and beyond.
4:30pm — Crude Oil Inventories
Crude Oil Inventories are forecast at -1.3M barrels — a draw, reversing the prior week’s build of 6.2M barrels. A draw of this magnitude would be supportive for oil prices, which have been under pressure from demand concerns driven by weak global PMI data. Higher oil prices reignite inflation concerns — watch for any second-order impact on gold and rate expectations if the inventory draw is larger than expected.
Key Levels and Full Market Summary
- Gold (XAU/USD): Consolidating $4,524–$4,556 · Target $4,660 · Invalidation below $4,524 · Key risk: UK CPI 9:00am, Import Prices 2:30pm
- GBP/USD: UK CPI at 9:00am is the binary trigger · Miss = sharp decline · Beat = limited bounce · MPC Member Greene at 2:00pm adds context
- EUR/USD: Lagarde at 10:45am + ifo at 11:00am · Both carry downside risk for EUR · Key support being tested
- AUD/USD: CPI miss overnight accelerates RBA cut pricing · Pair under pressure · RBA Assistant Governor Jones speaks at 4:40am — watch for any pushback
- USD/JPY: BOJ Monetary Policy Meeting Minutes at 1:50am — any hawkish nuance from the minutes would support yen · US Import Prices at 2:30pm drives afternoon direction
- S&P 500 / Nasdaq: Yesterday’s PMI-driven recovery needs follow-through · US Import Prices at 2:30pm is the key input · Hot print = hawkish concern = equity headwind
- DAX: ifo at 11:00am is the domestic driver · Miss adds to PMI weakness narrative · ECB cut pricing provides a floor
- WTI Crude: Inventory draw expected at 4:30pm · Draw supports prices · Belgian NBB Business Climate at 4:00pm adds to European demand picture
Gold has done the hard work. The $4,100 low held, the recovery structure is intact, and the consolidation above $4,524 is healthy. The next test is $4,588 — break that and $4,660 opens. The risks today are UK CPI at 9:00am and US Import Prices at 2:30pm. Both are inflation readings, both could briefly complicate the recovery if they print hot. But the broader direction — away from the post-FOMC lows and back toward pre-Fed levels — remains clearly upward.
Analysis based on the XAU/USD 15-minute chart as of March 25, 2026, 08:43 UTC+2. Economic data sourced from the daily macro calendar. This article is for informational and educational purposes only and does not constitute financial advice.

Written by T. S. Gospodinov
T. S. Gospodinov is an Independent gold market analyst focused on liquidity structures and macro-driven price cycles.