Gold cannot find a floor. XAU/USD extended its post-FOMC collapse through the weekend after Fed Chair Powell’s Saturday speech offered no dovish relief, with price dropping to a session low near $4,100 in the early March 23 Asian session before bouncing to current levels around $4,251. The 15-minute chart projects one more leg lower before a meaningful recovery can begin — and today’s light macro calendar offers little in the way of catalysts to accelerate that reversal.
The Chart: One More Dip Before the Turn
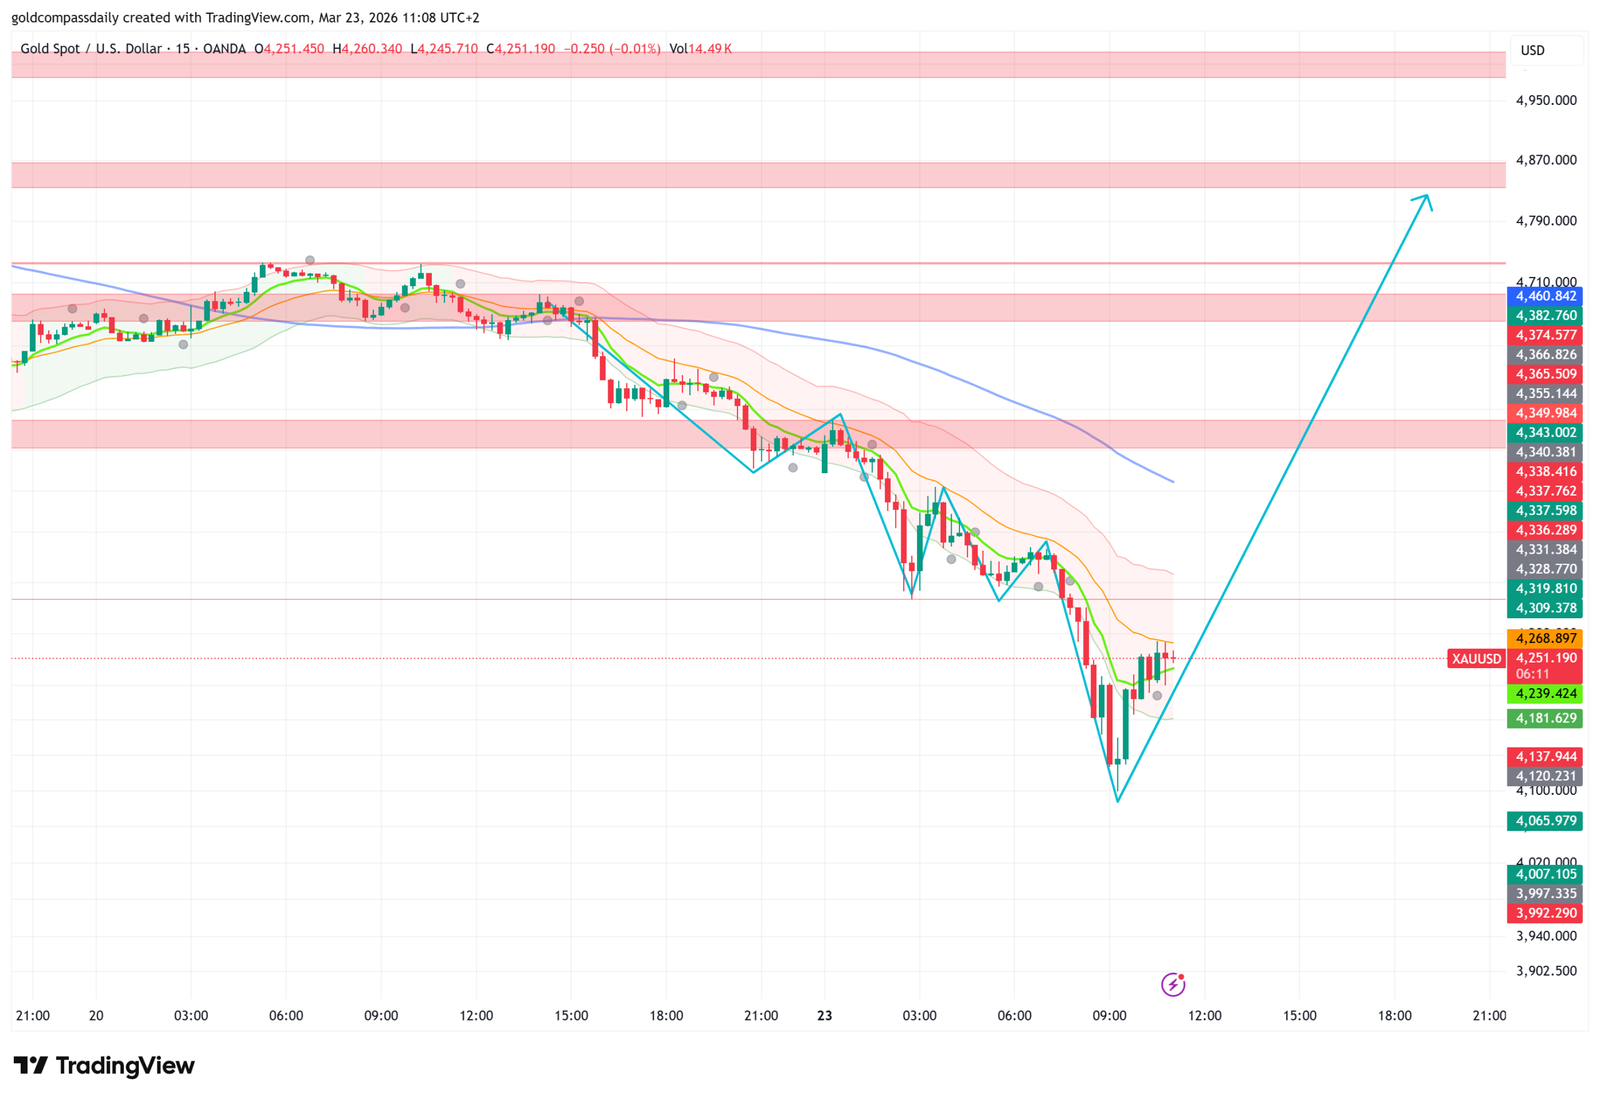
The structure on the 15-minute chart remains bearish but is showing the first tentative signs of exhaustion. Price bounced sharply from the $4,100 area — touching the green demand zone visible at $4,065.979 — but that bounce has already stalled near $4,268.897 and is rolling over again. The projected path on the chart shows one more push into the $4,100–$4,120 zone before buyers step in with conviction and the recovery toward $4,790 begins.
The overhead levels tell the story of how much damage has been done. What were support zones two weeks ago — $4,343, $4,382, $4,460 — are now layers of resistance that a recovery will need to work through one by one. The pink resistance band between $4,343.002 and $4,349.984 is the first meaningful ceiling. Above that, the $4,460.842 level and the broader zone toward $4,710 represent the medium-term recovery target visible on the chart.
The Bollinger Bands remain wide and pointing lower, and the moving averages are still in a bearish configuration. A recovery of this magnitude — from $4,100 to $4,790 — does not happen in a straight line. The chart projects a zig-zag path: one final dip to the $4,100–$4,120 zone, a hold, and then a sustained move higher through the resistance layers.
Why Gold Keeps Falling: The Powell Effect
Saturday’s speech by Fed Chair Powell at 7:30pm removed any lingering hope that the hawkish FOMC statement on Wednesday was a one-off. Powell reiterated that the Fed is not in a rush to cut rates, that the labour market remains resilient, and that inflation — while declining — has not fallen enough to justify easing. The dot plot from Wednesday signalled fewer cuts in 2026 than markets had priced, and Powell did nothing to walk that back.
For gold, the mechanism is straightforward: higher-for-longer rates mean higher real yields, a stronger dollar, and a higher opportunity cost of holding a non-yielding asset. Each of those three factors is currently working against XAU/USD simultaneously — a rare and powerful combination that explains the severity of the decline from the March highs above $5,200.
From peak to current trough, gold has dropped over $1,100 in less than two weeks. That pace of decline suggests significant forced liquidation — not just tactical selling. When liquidation-driven moves exhaust themselves, the reversals tend to be sharp. The $4,065–$4,120 green zone on the chart is where that exhaustion is expected to complete.
Today’s Macro Calendar: Minimal but Watched
Monday’s economic calendar is one of the lightest of the month — a natural pause after last week’s central bank deluge. Three releases are worth monitoring, none of which are primary gold drivers on their own.
At 2:45pm, FOMC Member Miran speaks. This is the first Fed communication since Powell’s Saturday appearance, and any deviation from the hawkish script — even a subtle acknowledgement of financial stability concerns — could provide a brief relief rally for gold. Conversely, if Miran echoes Powell’s higher-for-longer message, the recovery attempt from $4,251 faces another headwind. The market will be listening closely.
US Construction Spending m/m at 4:00pm is forecast at 0.1%, down from the prior 0.3%. A weaker-than-expected print would add to the accumulating evidence of a slowing US economy — which, paradoxically, could be gold-positive if it forces markets to price in Fed cuts sooner than currently signalled. A beat would reinforce the hawkish Fed narrative.
Eurozone Consumer Confidence at 5:00pm is forecast to deteriorate further to -15 from the prior -12. Weakening European consumer sentiment is a mild negative for the euro and reinforces the case for continued ECB easing — dollar-positive at the margin, which adds to gold’s headwinds. However, sentiment data of this type rarely moves gold meaningfully unless the miss is dramatic.
Key Levels and Scenarios
- Current price: $4,251 — bouncing but rolling over again
- Projected dip target: $4,100–$4,120 — final leg before reversal
- Green demand zone floor: $4,065.979 — structural support
- First resistance: $4,268.897 → $4,343.002 (pink zone)
- Recovery target: $4,790 — projected move from the chart
- Invalidation of recovery: Close below $4,065 — green zone fails, no floor in sight
- Key event risk today: FOMC Member Miran at 2:45pm
Bullish Scenario
Price completes the final dip to $4,100–$4,120, holds the green demand zone above $4,065.979, and reverses. A recovery above $4,268.897 signals the low is in. The move then targets the pink resistance band at $4,343–$4,349 as the first hurdle, with the broader recovery target at $4,790 as the week progresses. Miran strikes a balanced tone at 2:45pm — relief rally begins.
Bearish Scenario / Invalidation
Price fails to hold $4,120 on the next test and closes below $4,065.979. The green demand zone — which has been the structural floor throughout this selloff — fails. In that scenario, there is no established support until the $3,992–$4,007 zone visible at the bottom of the chart. Miran doubles down on Powell’s hawkish message — selling resumes.
Gold is at a critical juncture. The pace of the decline, the proximity to major structural support, and the light macro calendar today all point toward a stabilisation and potential reversal in the $4,100–$4,120 area. But the Fed has made its position clear, and until the data forces a rethink, the path of least resistance remains lower. Watch Miran at 2:45pm — and watch the $4,065 floor.
Analysis based on the XAU/USD 15-minute chart as of March 23, 2026, 11:08 UTC+2. Economic data sourced from the daily macro calendar. This article is for informational and educational purposes only and does not constitute financial advice.

Written by T. S. Gospodinov
T. S. Gospodinov is an Independent gold market analyst focused on liquidity structures and macro-driven price cycles.