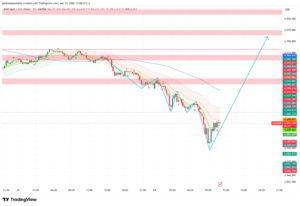
Gold is consolidating. After yesterday’s sharp reversal from the $4,100 area — a move that unfolded almost exactly as the morning analysis projected — XAU/USD is now trading around $4,390, sitting within a tight green demand zone between $4,380.546 and $4,382.760. The structure has shifted: lower highs have given way to a series of higher lows, and the 15-minute chart projects a continuation toward $4,720 as the next meaningful target. Today’s calendar is dominated by global Flash PMI data — a comprehensive real-time snapshot of economic conditions across four continents — with the US reading at 3:45pm as the session’s primary market mover.
The Chart: Consolidation Is the Setup
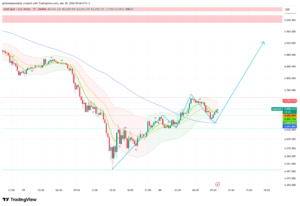
The recovery from yesterday’s $4,100 low has been orderly rather than explosive — which is typically a healthy sign. Price pushed to $4,453.225 on the initial bounce, pulled back into the green demand zone overnight, and is now building a base above $4,380. Each pullback since the reversal has held higher than the last — a textbook higher-low structure that confirms buyers are stepping in progressively.
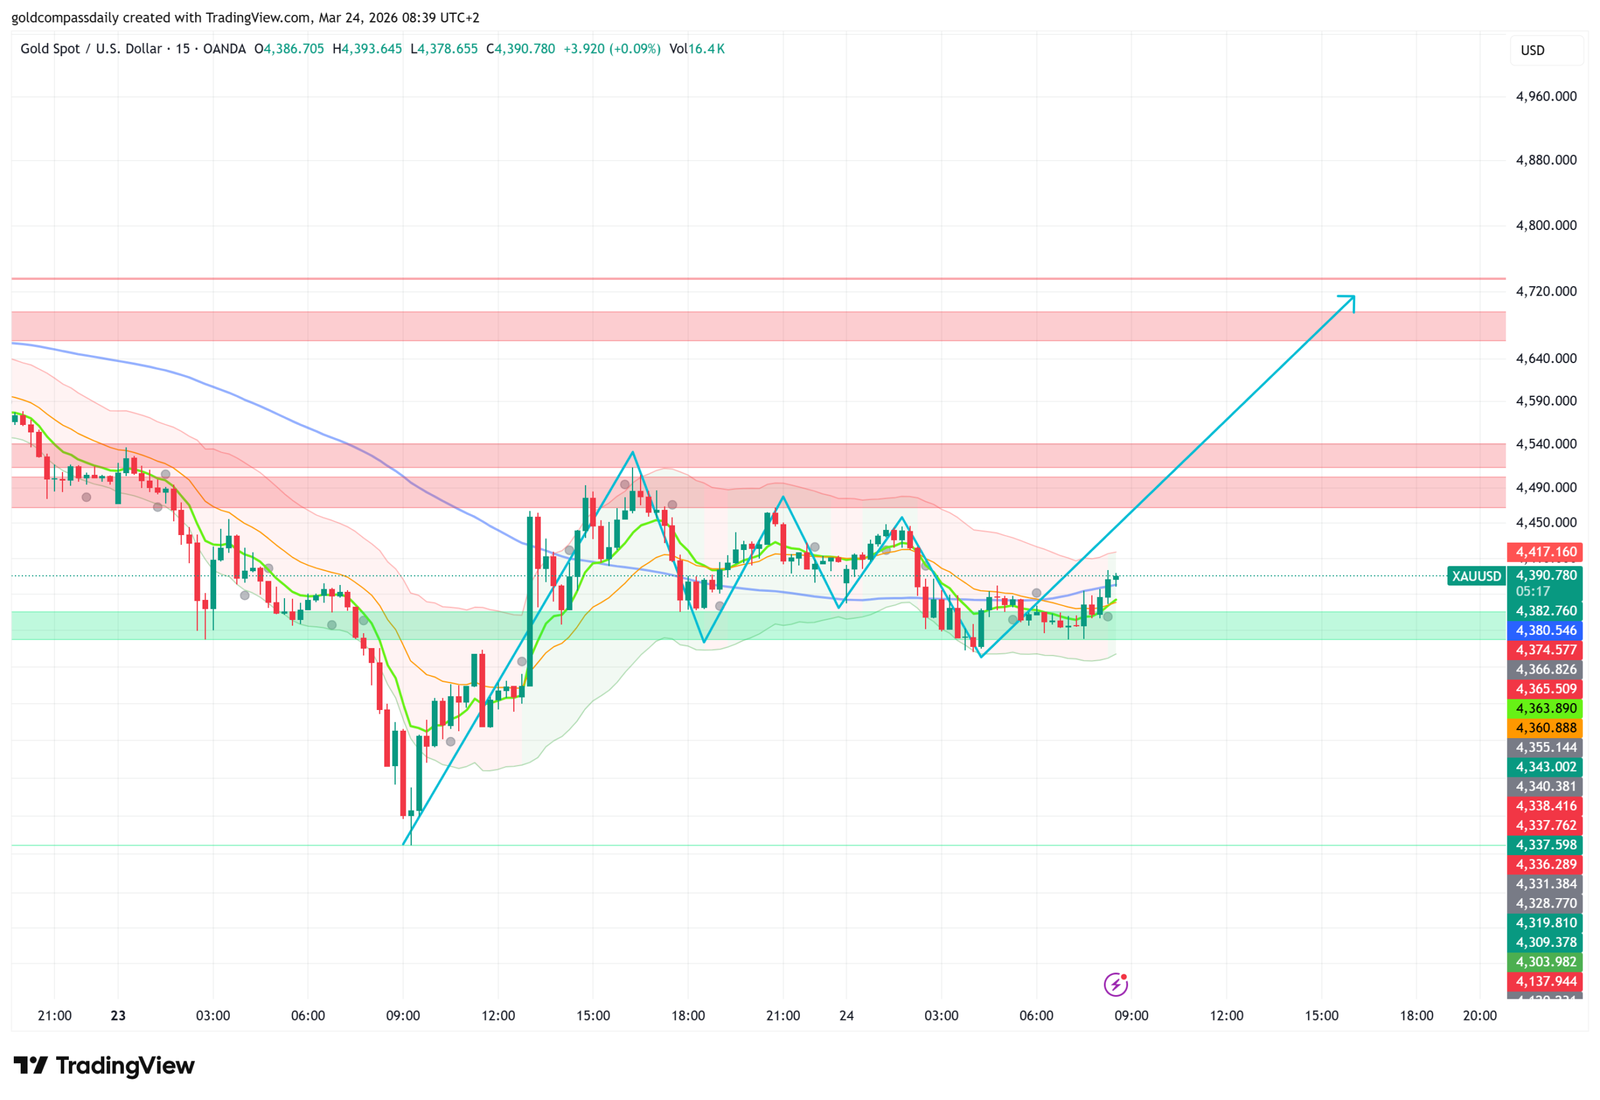
The immediate resistance levels are well-defined. The pink zone between approximately $4,490 and $4,540 is the first meaningful ceiling — price tested its lower boundary yesterday afternoon before retreating. Above that, a second pink band sits around $4,640–$4,680. The projected move on the chart targets $4,720, which sits just above the upper pink resistance band and represents the first significant recovery milestone since the post-FOMC collapse began.
The green demand zone at $4,374–$4,382 is the floor that needs to hold. As long as price respects that level on any intraday pullbacks, the bullish recovery structure remains intact. A close below $4,360.888 would be the first warning sign that the bounce is losing momentum.
Global PMI Day: What the Data Is Already Saying
Tuesday is global Flash PMI day — the first comprehensive read on March economic activity across manufacturing and services. The picture that is emerging is nuanced: services remain resilient in most economies while manufacturing continues to struggle, particularly in Europe.
Australia’s Flash Manufacturing PMI printed at 50.1 against a prior of 51.0 — still in expansion but slowing. The Flash Services PMI came in at 46.6, a sharp drop from the prior 52.8 and well into contraction territory. That is a significant deterioration for the Australian services sector and is weighing on the AUD this morning.
Japan’s Flash Manufacturing PMI came in at 51.4, above both the forecast of 53.2 and the prior 53.0 — a beat that confirms continued expansion in Japanese factory output. This follows yesterday’s strong Revised Industrial Production data and reinforces the picture of a resilient Japanese economy. The yen is modestly supported.
Japan’s National Core CPI y/y printed at 1.6% against a forecast of 1.7% and a prior of 2.0% — a notable deceleration in Japanese inflation. That reduces pressure on the BOJ to hike rates further and is mildly yen-negative, partially offsetting the strong PMI.
European PMIs: Manufacturing Contracting, Services Holding
The European PMI sequence runs from 10:15am through 11:00am and paints a consistent picture of divergence between sectors.
French Flash Manufacturing PMI is forecast at 49.4 (prior 50.1) — slipping back into contraction. French Flash Services PMI at 49.2 (prior 49.6) — also contracting. France is the weakest major Eurozone economy in today’s data, and a double-miss below 49 would add pressure to EUR/USD and reinforce the case for continued ECB easing.
German Flash Manufacturing PMI is forecast at 49.6 (prior 50.9) — expected to slip back below the 50 expansion threshold after last month’s brief recovery. German Flash Services PMI at 52.5 (prior 53.5) — still expanding but slowing. Germany’s manufacturing sector returning to contraction would be a meaningful signal, given that it was one of the few bright spots in European data earlier this year.
The Eurozone composite Flash PMIs at 11:00am — Manufacturing forecast 49.4 (prior 50.8), Services forecast 51.1 (prior 51.9) — suggest a Eurozone economy that is growing slowly at best, with manufacturing acting as a persistent drag. For EUR/USD, weak PMIs add to the case for ECB cuts and keep the pair under pressure from both sides: a dovish ECB and a hawkish Fed.
For gold, weak European PMIs are a double-edged signal. On one hand, they reinforce global growth concerns that historically support safe-haven demand for gold. On the other, they tend to strengthen the dollar by weakening the euro — and a stronger dollar is a near-term headwind for XAU/USD. The net effect typically favours gold when the PMI weakness is accompanied by equity market selling.
UK PMIs at 11:30am: Services Are the Key
UK Flash Manufacturing PMI is forecast at 50.0 (prior 51.7) — right on the expansion-contraction line. UK Flash Services PMI at 52.8 (prior 53.9) — still comfortably in expansion but decelerating. The UK services sector has been the primary driver of above-target inflation that has kept the BOE cautious on cuts. A reading below 52 on services would materially shift the rate cut calculus and weaken sterling.
GBP/USD is sensitive to the services number specifically. Yesterday’s labour market data already showed wage growth slowing — a weak services PMI today would complete the picture of a softening UK economy and bring a May BOE cut firmly into market pricing.
US PMIs at 3:45pm: The Session Decider
The most important release of the day for gold arrives at 3:45pm with the US Flash Manufacturing and Services PMIs. Manufacturing is forecast at 51.5 (prior 51.6) — roughly unchanged, modest expansion. Services is forecast at 52.0 (prior 51.7) — a slight improvement. Both priors were already in modest expansion territory, suggesting the US economy is holding up better than Europe.
The market reaction will be asymmetric. A beat — particularly on services — confirms US economic resilience, validates the hawkish Fed stance, strengthens the dollar, and creates a short-term headwind for gold as it approaches the $4,490 resistance zone. A miss — especially a services print below 50 — would be a significant shock, casting doubt on the Fed’s higher-for-longer narrative and potentially triggering a sharp gold rally through resistance levels that have capped the recovery so far.
Watch the services number at 3:45pm. That single print has the most potential to accelerate or derail the recovery toward $4,720.
Additional Catalysts: Labor Costs and Fed Speakers
At 2:30pm, Revised Nonfarm Productivity q/q is forecast at 1.9% (prior 2.8%) and Revised Unit Labor Costs q/q at 3.6% (prior 2.8%). Higher unit labor costs are inflationary — a reading above 3.6% would reinforce the Fed’s inflation concerns and support the hawkish stance. Lower than expected would be dollar-negative and gold-supportive.
SNB Chairman Schlegel speaks at 7:00pm — after the post-FOMC global central bank reaction, any language around the Swiss franc or rate policy will be closely watched. The SNB is one of the few central banks with room to cut further, and any dovish signal from Schlegel would contribute to the broader dollar-strength environment.
Key Levels and Scenarios
- Support / Base zone: $4,380.546 – $4,382.760 (green demand band)
- Invalidation: Close below $4,360.888 — recovery structure weakens
- First resistance: $4,417.160 → $4,490–$4,540 (pink zone)
- Second resistance: $4,640–$4,680 (upper pink band)
- Primary target: $4,720 — projected recovery from the chart
- Key event: US Flash Services PMI at 3:45pm — beat pressures gold, miss accelerates rally
Bullish Scenario
Price holds the green zone above $4,380, US PMIs come in at or below forecast at 3:45pm, and gold breaks through $4,417 toward the $4,490 pink zone. A close above $4,540 opens the path to $4,720 as the week progresses.
Bearish Scenario / Invalidation
US Flash Services PMI beats significantly above 53, the dollar strengthens, and gold fails to hold the $4,380 demand zone. A close below $4,360.888 would signal the recovery is stalling and bring the $4,303–$4,309 area back into focus.
Yesterday’s call was right. The setup today is simpler: hold the green zone, watch 3:45pm, target $4,720. The recovery is underway — the PMI data decides how fast it gets there.
Analysis based on the XAU/USD 15-minute chart as of March 24, 2026, 08:39 UTC+2. Economic data sourced from the daily macro calendar. This article is for informational and educational purposes only and does not constitute financial advice.

Written by T. S. Gospodinov
T. S. Gospodinov is an Independent gold market analyst focused on liquidity structures and macro-driven price cycles.