
Gold is searching for a floor on the most important day of the month. After a sharp two-day decline from $4,720 to the current level of $4,559 — driven by a combination of profit-taking from the April rally, dollar stabilisation, and pre-FOMC positioning — XAU/USD is consolidating in a tight range as markets hold their breath ahead of tonight’s Federal Reserve decision. The 15-minute chart projects one more dip to $4,558 before a recovery toward $4,640+, but the technical setup is entirely secondary to the macro reality: the Federal Funds Rate decision at 9:00pm, followed by the FOMC Statement and Powell’s press conference at 9:30pm, will set gold’s direction not just for today but for the weeks ahead.
The Chart: Finding the Floor Before the Fed
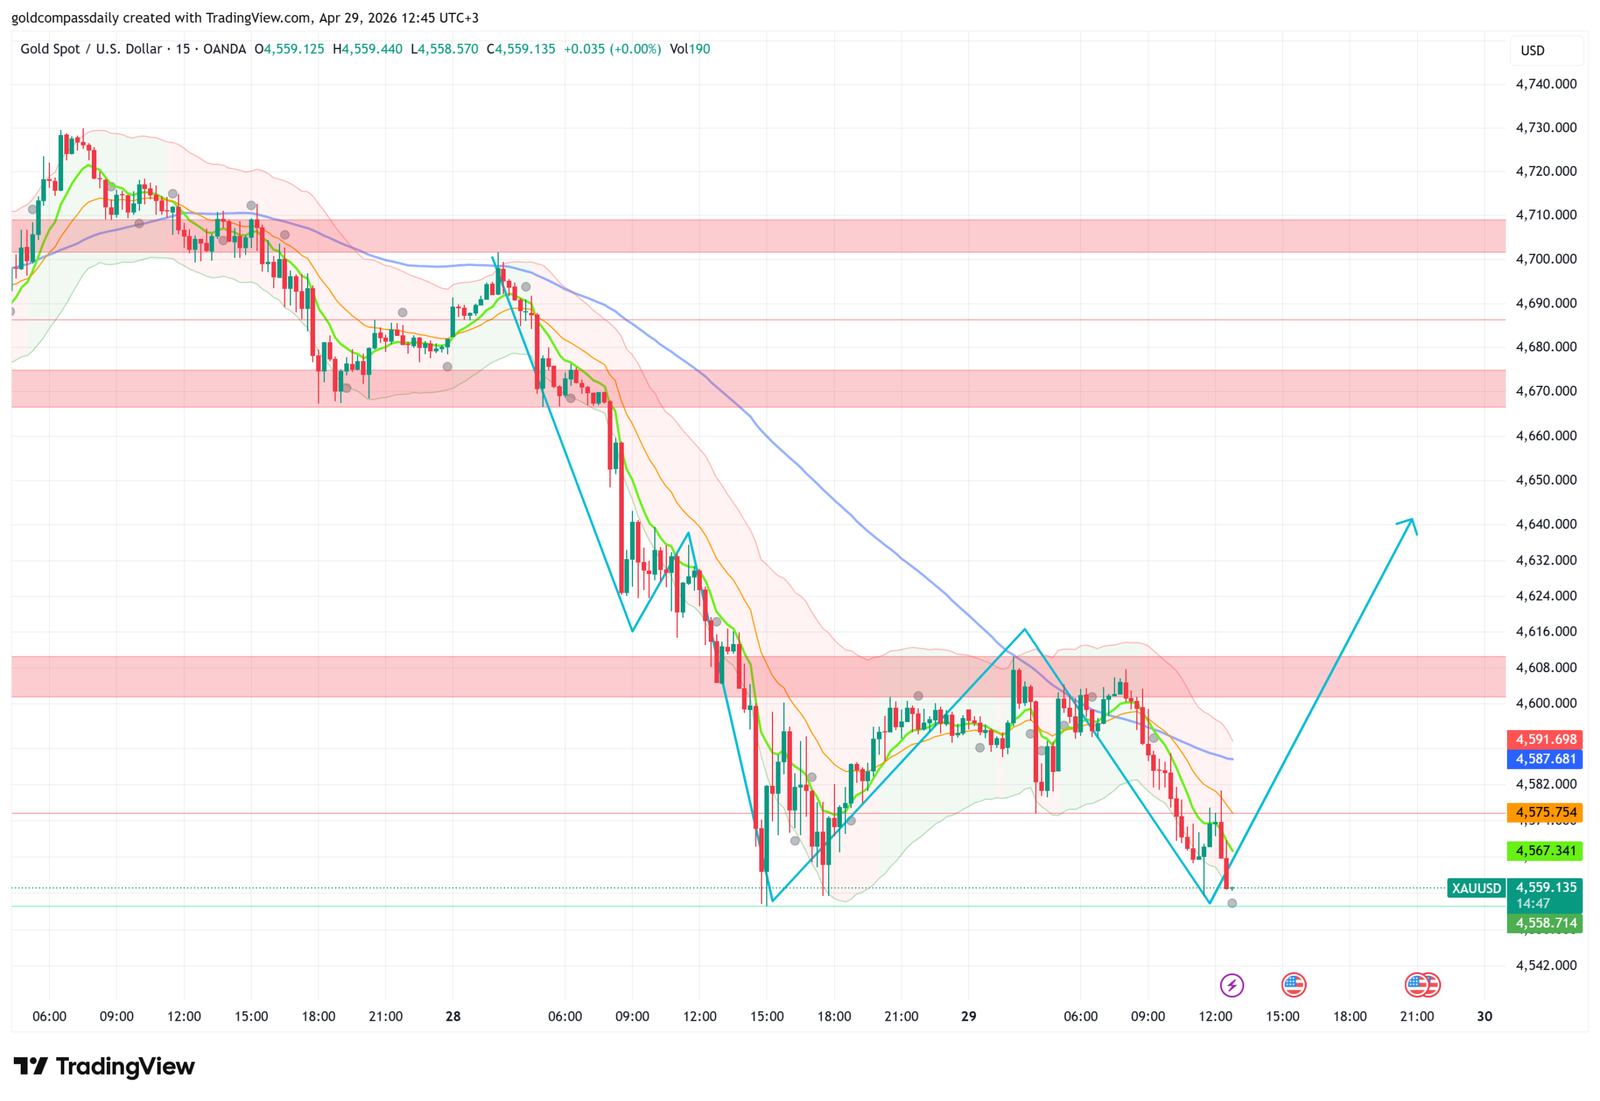
The 15-minute chart tells a story of exhaustion. The decline from $4,720 has been orderly — lower highs, lower lows — but the pace has slowed dramatically over the past several hours. Price is currently sitting on the dotted support level at $4,558.714, with the green demand zone visible just below between approximately $4,542–$4,558. The Bollinger Bands have expanded downward but are beginning to flatten, and the moving averages — while still pointing lower — are losing their downward slope.
The projected path on the chart shows one more push into the $4,558 area before buyers step in for the recovery toward $4,640+. That move would need to clear the pink resistance band at $4,600–$4,608 and then the upper pink zone at $4,670–$4,710 on the way back toward the April highs. The critical question is whether the FOMC tonight provides the catalyst for that recovery — or whether a hawkish surprise extends the decline toward $4,542 and below.
The floor is $4,542. A close below that level breaks the short-term support structure and brings the $4,488–$4,500 area back into focus. Above $4,591.698, the recovery is underway.
Already Published: Australian CPI Beats — Stagflation Signal
The session opened with a significant inflation surprise from Australia. CPI m/m printed at 1.1% — above the forecast of 1.3%… wait: actual 1.1% versus forecast 1.3% is a miss. However, CPI y/y at 4.6% — significantly above the forecast of 4.8%… again a miss: 4.6% versus 4.8% forecast. Both monthly and annual Australian CPI came in below forecasts, while the Trimmed Mean CPI m/m held at 0.3% in line with the forecast of 0.3% and above the prior 0.2%.
The net read: Australian inflation is decelerating faster than expected — the headline miss on both m/m and y/y reduces the urgency for RBA tightening and increases the probability of a May RBA cut. The AUD faces modest downward pressure on the softer-than-expected inflation data.
AUD/USD impact: CPI miss = RBA cut more likely = AUD weakens. The prior strong employment data (48.9K in March) provided cover for the RBA to hold — but softer CPI removes that justification. May cut is now the base case.
All Day — German Prelim CPI: The Eurozone Inflation Barometer
The German Preliminary CPI m/m is published throughout the day with a forecast of 0.7% (prior 1.1%). An expected deceleration in German monthly consumer prices — from 1.1% to 0.7% — would be a disinflationary signal that gives the ECB additional room to cut rates. A reading that beats the forecast (above 0.9%) would complicate the ECB’s dovish narrative and could provide brief EUR support.
German CPI is the leading indicator for tomorrow’s Eurozone Flash CPI estimate — if Germany comes in soft today, tomorrow’s Eurozone reading is likely to follow the disinflationary trend. For gold, falling European inflation reduces the inflation hedge demand from Europe but simultaneously makes the ECB more dovish — a net dollar-strengthening, gold-headwind dynamic in the short term.
10:00am — Spanish Flash CPI: The Outlier Watch
Spanish Flash CPI y/y printed at 3.2% — below the forecast of 3.5% and the prior 3.3%. Spain’s inflation is decelerating — the country that had been the Eurozone’s inflation outlier with readings above 3% is now showing a clear downward trend. This is EUR-negative (removes hawkish ECB argument from the highest-inflation member) but gold-neutral in isolation.
11:00am — Swiss UBS Economic Expectations and Eurozone Credit
UBS Economic Expectations at -30.3 (prior -35.0) — an improvement from the deeply negative prior reading but still firmly in pessimistic territory. Swiss institutional investors are less negative about the economic outlook than last month — the Liberation Day shock appears to be partially absorbed in survey data. A reading less negative than -30 would be mildly CHF-positive. The prior -35 was one of the most pessimistic readings since 2023.
Eurozone M3 Money Supply y/y at 3.2% (prior 3.1%) and Private Loans y/y at 3.0% (prior 3.0%) — both in line or slightly improved. Credit growth holding at 3% signals that the ECB’s prior rate cuts are slowly filtering into lending activity. Stable and slightly improving credit data is a mild positive for EUR at the margin.
Bond Auctions: The Yield Signal
Two significant European bond auctions today. Italian 10-year Bond Auction at 12:17pm showed a yield of 3.77% (prior 4.09%) — a significant drop in Italian borrowing costs. Lower Italian yields signal improved sovereign risk appetite in Europe and are EUR-positive. German 10-year Bond Auction at 12:32pm at 3.08% (prior 2.92%) — a slight increase in German bund yields, reflecting the global bond market repricing from tariff inflation concerns. The Italian-German spread narrowing is a positive signal for Eurozone financial stability.
3:30pm — US Data Avalanche: The Pre-FOMC Snapshot
A comprehensive set of US releases arrives at 3:30pm — the last significant data before the FOMC decision at 9:00pm. Markets will use this data to calibrate their final positioning.
Durable Goods Orders m/m forecast at 0.4% (prior -1.3%) — an expected bounce from last month’s sharp decline. Core Durable Goods Orders m/m forecast at 0.4% (prior 0.9%) — a deceleration from the prior strong reading. Core durable goods is the most watched component — it tracks business investment in equipment, excluding the volatile transportation sector. A reading below 0.2% would signal that businesses are cutting capital expenditure in response to tariff uncertainty, which is a significant growth concern. A reading above 0.5% would be a positive surprise that validates corporate confidence despite the tariff environment.
Goods Trade Balance forecast at -$87.5B (prior -$83.5B) — a widening of the US trade deficit. In the context of Liberation Day tariffs, a widening deficit is paradoxical — the tariffs were designed to reduce the deficit, but import front-running ahead of tariff implementation has been pushing the deficit wider in recent months. A deficit significantly wider than -$87.5B would be politically significant and could provoke fresh tariff rhetoric from the Trump administration.
Housing Starts forecast at 1.38M (prior 1.49M) — a meaningful expected decline in new residential construction. Combined with last month’s Halifax HPI miss and weak Construction PMI data, the housing sector is sending consistent signals of stress. A Housing Starts reading below 1.30M would be a recession-adjacent signal for the US economy.
USD impact: The data avalanche at 3:30pm is the final pre-FOMC positioning window. Weak Core Durable Goods + wide trade deficit + low Housing Starts = dollar weakens heading into the FOMC = gold recovers from the $4,558 support toward $4,591. Strong data = dollar holds = gold stays pressured at support.
4:45pm — Bank of Canada: The Pre-FOMC Rate Decision
The BOC Overnight Rate is expected to hold at 2.25% (prior 2.25%). The BOC Rate Statement and Monetary Policy Report at 4:45pm, followed by the press conference at 5:30pm, will be the last major central bank communication before the FOMC tonight.
Canada faces a unique challenge: the Liberation Day tariffs hit Canadian exports directly, particularly in automotive, energy, and agricultural sectors. The BOC’s language around trade policy uncertainty and its impact on the Canadian growth outlook will be closely watched. A BOC that emphasises the tariff growth downside (more cuts coming) would be CAD-negative and provide a preview of how central banks globally are framing the tariff dilemma — relevant context for interpreting tonight’s FOMC statement.
USD/CAD: BOC hold with dovish language = CAD weakens = pair higher. BOC hold with hawkish language (tariff inflation concern) = CAD support. The press conference at 5:30pm is the most market-sensitive BOC output.
9:00pm — FOMC: The Only Decision That Matters
Everything today leads to this moment. The Federal Funds Rate is expected to hold at 3.75% — the consensus is near-unanimous for no change. The decision itself will not move markets. What will move markets is the FOMC Statement at 9:00pm and Chair Powell’s press conference at 9:30pm.
The context could not be more complex. Since the March hawkish hold — the decision that triggered gold’s collapse from $5,200 — the economic landscape has shifted dramatically: Liberation Day tariffs have introduced both inflationary pressure and growth headwinds, consumer confidence has deteriorated, PMI data has softened, and the labour market — while still resilient — shows early signs of slowing. The Fed must now communicate policy in an environment where its two mandates (inflation and employment) are pulling in opposite directions.
Three scenarios define the evening’s market reaction:
Scenario 1 — Hawkish hold: The FOMC Statement emphasises inflation risks from tariffs, the dot plot signals no cuts in 2026, and Powell dismisses the growth slowdown as temporary. Dollar strengthens sharply, gold falls through $4,542 support toward $4,488, equities extend recent losses. This is the outcome gold bears are positioned for.
Scenario 2 — Balanced hold (base case): The statement acknowledges both the inflation risk and the growth uncertainty from tariffs, Powell introduces “two-sided risk” language, and the door to cuts later in 2026 is left open without a firm signal. Dollar is mildly weaker, gold recovers from $4,558 toward $4,591–$4,608. This is the most likely outcome — the Fed acknowledging reality without committing to a policy change.
Scenario 3 — Dovish pivot signal: The statement explicitly references deteriorating economic conditions, Powell signals that the bar for cuts has moved lower, or the dot plot is revised to show earlier cuts. Dollar weakens sharply, gold surges through the $4,600–$4,670 resistance bands toward $4,720+. This is the lowest-probability but highest-impact scenario for gold — the catalyst that would confirm April’s $4,100–$4,900 recovery as the beginning of a new bull leg.
The key phrases to watch in the FOMC Statement: “elevated uncertainty,” “monitoring both sides of the mandate,” “tariff-related price increases are transitory,” “labour market remains solid.” The combination and framing of these phrases will determine the market read within seconds of release.
Powell’s press conference at 9:30pm will then either confirm or complicate the statement’s initial interpretation. His handling of questions about the tariff inflation dilemma — whether he frames it as a reason to hold firm or a reason for caution — will write gold’s direction for the next two weeks.
Key Levels and Full Market Summary
- Gold (XAU/USD): $4,559 · Dip target $4,558 (current support) · Pink resistance $4,600–$4,608 → $4,670 · Target $4,640+ · Floor $4,542 · FOMC at 9:00pm + Powell 9:30pm are everything
- EUR/USD: German CPI all day + Spanish CPI miss · ECB cut case strengthening · Dollar direction from US data at 3:30pm and FOMC at 9:00pm · Dovish FOMC = EUR recovers · Hawkish = breaks 1.07
- GBP/USD: No major UK data today · Follows EUR/USD direction · FOMC-driven close
- AUD/USD: CPI miss reduces RBA hawkish case · May cut now base case · BOC dovish language at 5:30pm adds risk-off context · FOMC drives the close
- USD/CAD: BOC hold expected · Dovish BOC language = CAD weakness · FOMC hawkish = USD/CAD higher
- USD/JPY: Japan bank holiday = thin JPY liquidity · FOMC is the primary driver · Dovish FOMC = sharp pair decline on yen safe-haven + rate differential compression
- S&P 500 / Nasdaq: Pre-FOMC positioning cautious · Scenario 2 (balanced) = modest rally · Scenario 1 (hawkish) = sharp decline · Scenario 3 (dovish pivot) = strong rally led by Nasdaq
- US Treasuries: 10-year yield direction after FOMC is the primary fixed income signal · Dovish FOMC = yields fall = gold rallies · Hawkish = yields spike = gold falls
- WTI Crude: Crude Oil Inventories at 5:30pm (forecast 0.3M vs prior 1.9M) · Small expected build · FOMC risk sentiment drives the close more than inventory data
- Gold structural case: Whether the Fed pivots or not tonight, the tariff inflation + growth slowdown + safe-haven demand backdrop remains intact · A hawkish FOMC creates a buying opportunity at $4,542 · A dovish FOMC confirms $4,720 retest
Gold at $4,559 is not a broken market — it is a market waiting for clarity. The two-day decline from $4,720 is pre-FOMC positioning, not a structural reversal. The $4,558 support has held on every test today. The FOMC at 9:00pm provides the verdict. A balanced or dovish Fed tonight means the April recovery from $4,100 continues toward new highs. A hawkish surprise means one more test of lower support before the structural bull case reasserts itself. Either way, tonight’s decision is the one that matters — everything else today is noise.
Analysis based on the XAU/USD 15-minute chart as of April 29, 2026, 12:45 UTC+3. Economic data sourced from the daily macro calendar. This article is for informational and educational purposes only and does not constitute financial advice.