
As of mid-day on February 17, 2026, Gold (XAU/USD) is navigating a crucial technical junction on the 15-minute chart. After a sharp rebound from the $4,860 liquidity floor, price action is currently challenging the 0.5 Fibonacci retracement level for the second time, setting the stage for a potential structural shift in intraday momentum.
The 0.5 Fibonacci Battleground
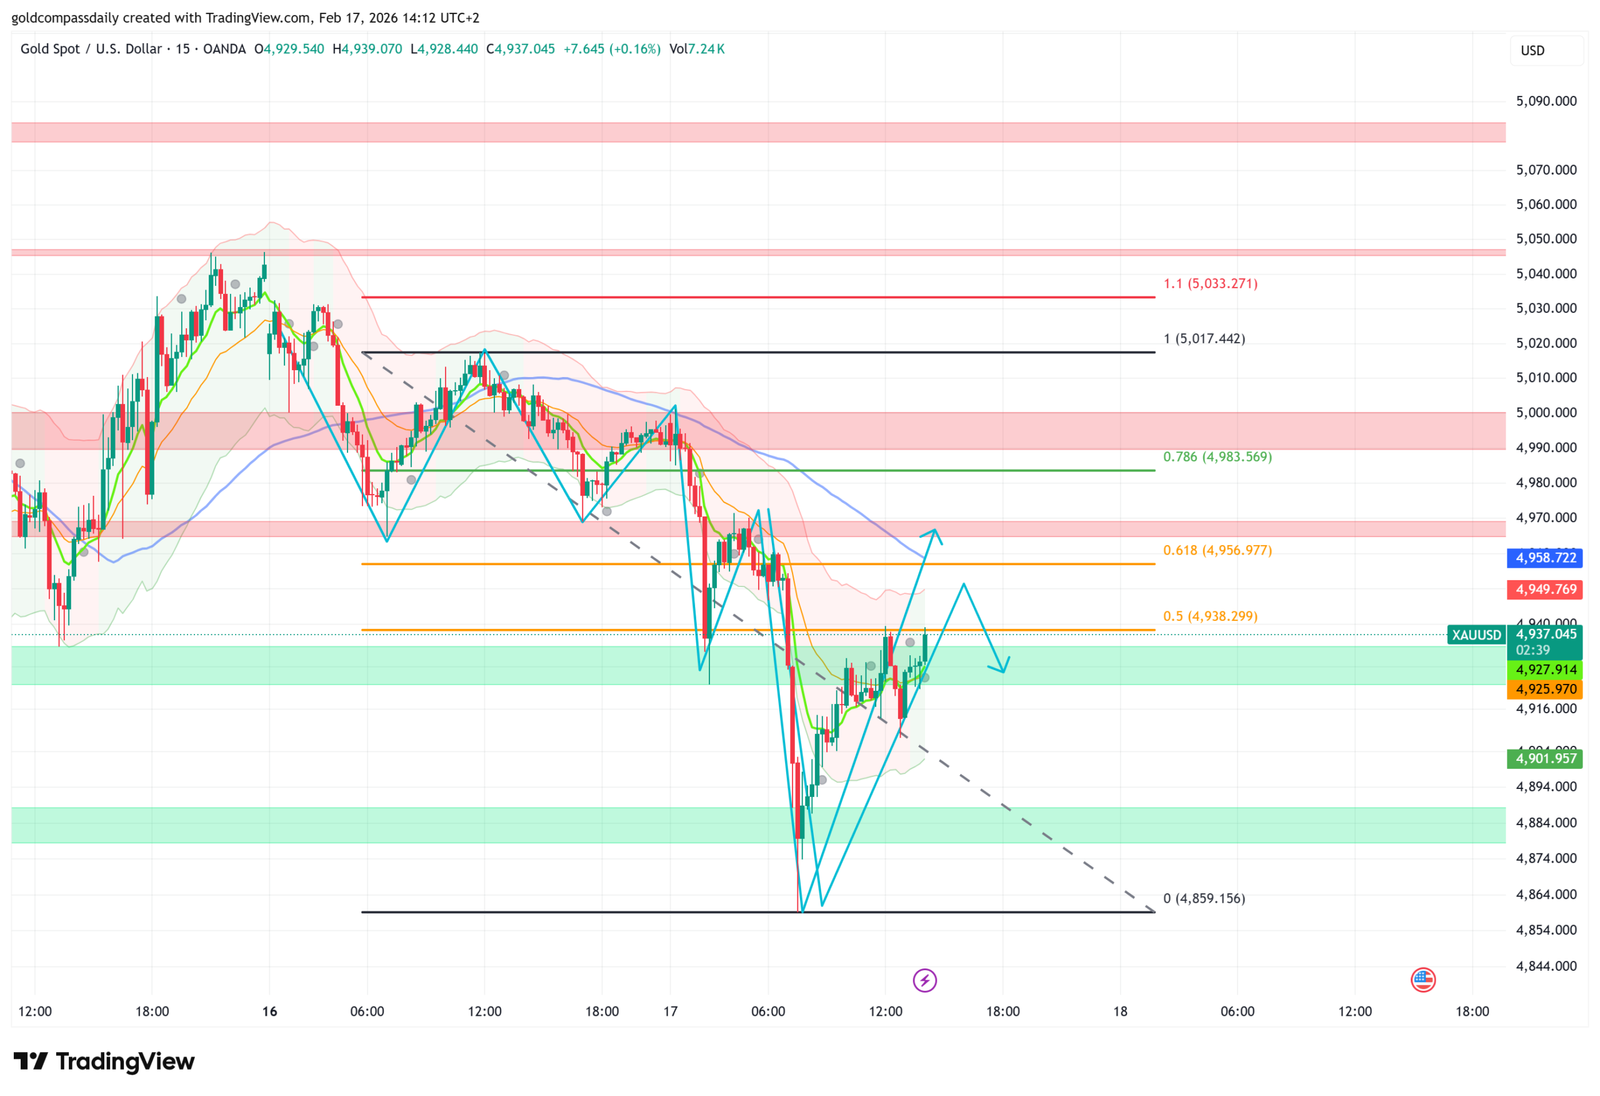
The market is showing high sensitivity to the 0.5 Fibonacci level at $4,938. This level is acting as a definitive “line in the sand” for short-term sellers. Following a minor correction from the first attempt, Gold is now exerting renewed pressure on this resistance cluster. A sustained breakout and candle close above this mark would confirm that the current pullback has bottomed out, shifting the bias from neutral to aggressively bullish.
- Second Test Significance: Repeated tests of a Fibonacci level often weaken the opposing supply, increasing the probability of a high-volume breakout toward the upper retracement zones.
- Support Confluence: The dynamic support provided by the ascending trendline remains intact, providing the necessary floor for this retest phase.
Upside Objectives: Targeting the 0.786 Retracement
If the 0.5 level is successfully flipped into support, the path is projected to clear toward the 0.786 Fibonacci retracement at $4,983. This zone represents a significant historical supply area and serves as the primary technical objective for the current recovery leg.
- Intermediate Target (0.618): Expect a brief pause or minor consolidation around $4,956 before the final push toward the $4,983 ceiling.
- Invalidation Zone: A failure to hold the $4,925 structural support would invalidate this immediate bullish thesis and likely lead to a re-test of the $4,860 lows.
Technical Matrix & Fibonacci Levels
| Fibonacci Level | Price Point | Market Outlook |
|---|---|---|
| 0.786 Retracement | $4,983.56 | Primary Expansion Target |
| 0.618 Retracement | $4,956.97 | Secondary Resistance |
| 0.50 Retracement | $4,938.29 | Current Active Pivot (Testing) |
| Trend Low (0.0) | $4,859.15 | Major Liquidity Floor |
Disclaimer: This intraday analysis is based on current technical patterns observed in the XAU/USD pair. Trading precious metals involves high risk. Ensure your stop-loss parameters are set according to individual risk tolerance as the market approaches the $4,980 supply zone.

Written by T. S. Gospodinov
T. S. Gospodinov is an Independent gold market analyst focused on liquidity structures and macro-driven price cycles.


