
As of February 23, 2026, Gold (XAU/USD) has validated the “dip and rip” thesis. After a minor corrective phase earlier in the session, the asset has found strong buyer interest near the $5,100 – $5,120 confluence zone. Driven by a “perfect storm” of geopolitical black swans—including a fresh 15% global tariff executive order and heightened Middle East tensions—the path of least resistance has firmly shifted back to the upside.
The Correction Phase: Validating the Floor
The anticipated minor dip allowed the market to flush out over-leveraged long positions. Technical support held firmly at the 0.5 Fibonacci retracement level near $5,000, which has now transitioned from a psychological barrier to a formidable structural floor. This rejection of lower prices confirms that institutional demand remains robust as investors seek refuge from trade-war uncertainties.
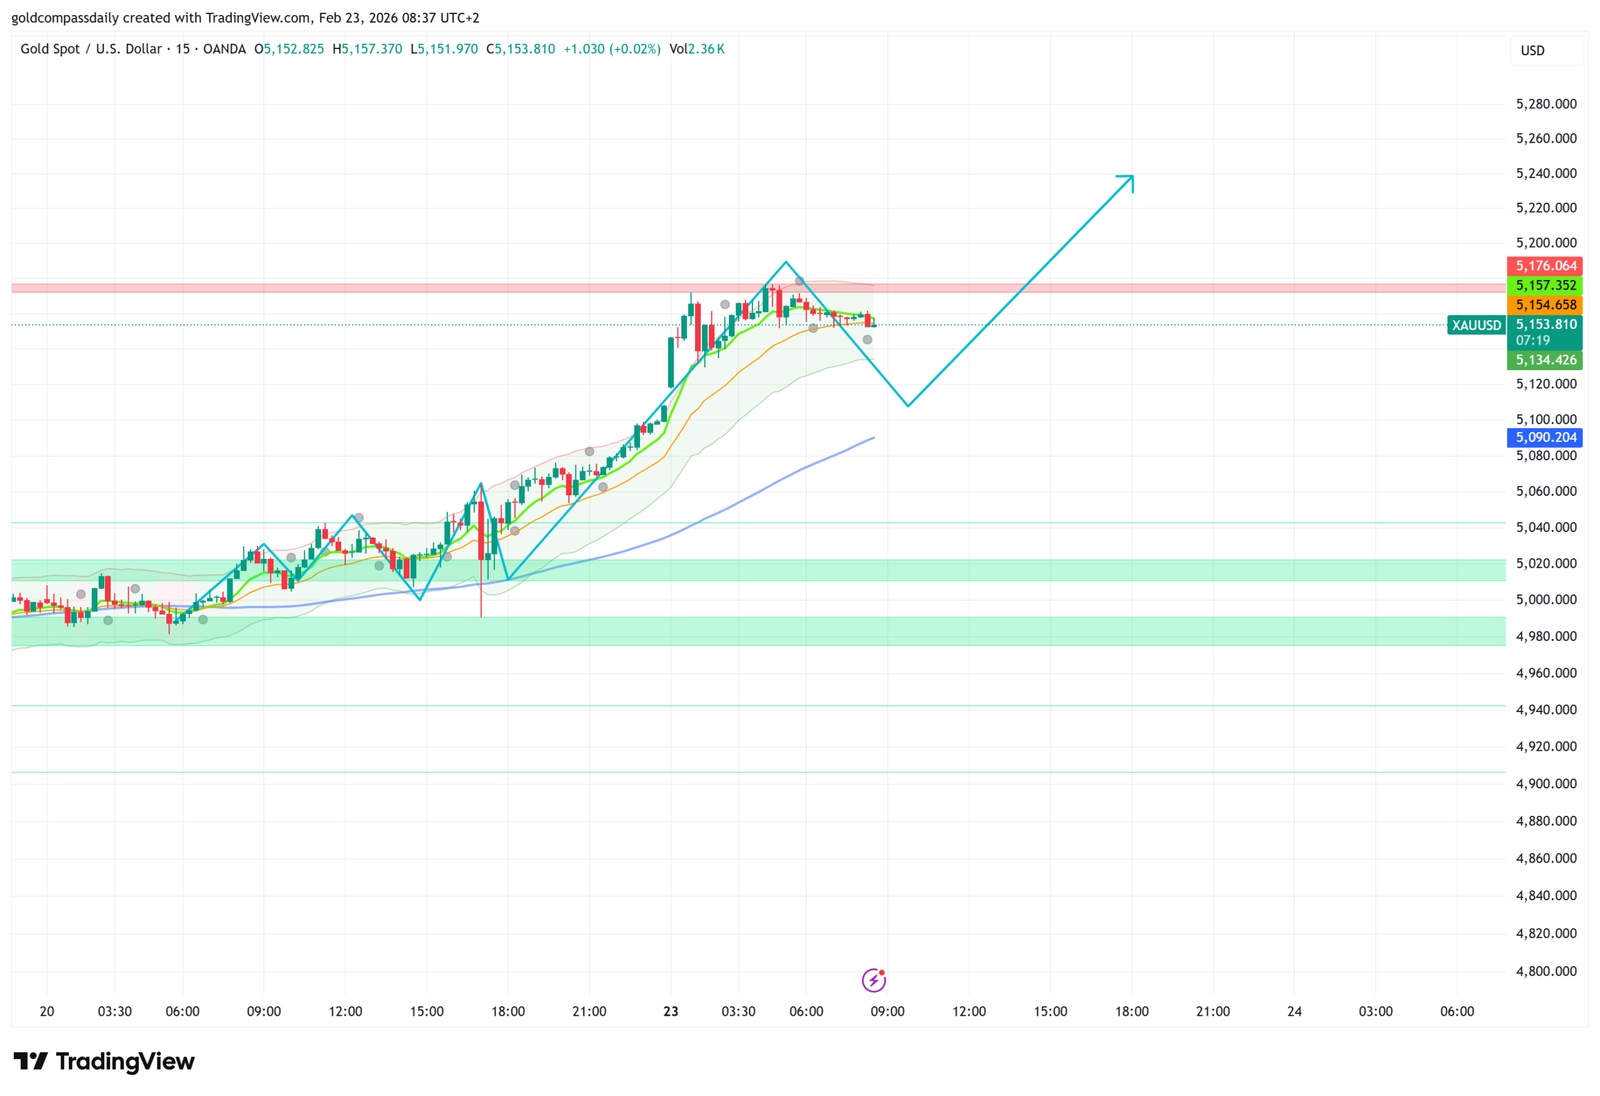
- Support Zone: The $5,080 – $5,100 range acted as the primary accumulation pocket for this morning’s move.
- Momentum Reset: RSI has cooled from overbought territories to a healthy 55–60 range, providing the “fuel” needed for a sustained leg higher.
Upside Expansion: Targets Toward $5,300
With the price currently coiling near $5,160, the immediate objective for bulls is a decisive breakout above the recent local high. Market structure suggests that once the $5,170 level is breached on a 4-hour close, the next major liquidity magnets become active.
- Primary Target: The $5,290 zone, a former intraday support that collapsed in late January, is now the key resistance target.
- Secondary Target: The 0.786 Fibonacci retracement near $5,342 remains the medium-term goal for the current weekly cycle.
Technical Support & Resistance Matrix
| Strategic Milestone | Price Level | Market Outlook |
|---|---|---|
| Expansion Target | $5,290 – $5,340 | Fibonacci Extension / Supply Reclaim |
| Immediate Resistance | $5,170 | Breakout Confirmation Pivot |
| Major Support | $5,080 – $5,100 | Post-Correction Baseline |
| Invalidation Floor | Below $4,982 | Shift in Short-Term Sentiment |
Disclaimer: This analysis is based on real-time chart patterns and geopolitical drivers as of Feb 23, 2026. Trading gold is high-risk. Ensure stop-losses are adjusted to account for the current 2% intraday volatility levels.

Written by T. S. Gospodinov
T. S. Gospodinov is an Independent gold market analyst focused on liquidity structures and macro-driven price cycles.


