Gold Price Analysis 2026: Is the $5,000 Rebound for Real?
T. S. Gospodinov
Wed, February 4, 2026 at 4:14 AM • 3 min read

Gold Price Analysis 2026: A Top-Down View of the $5,000 Rebound
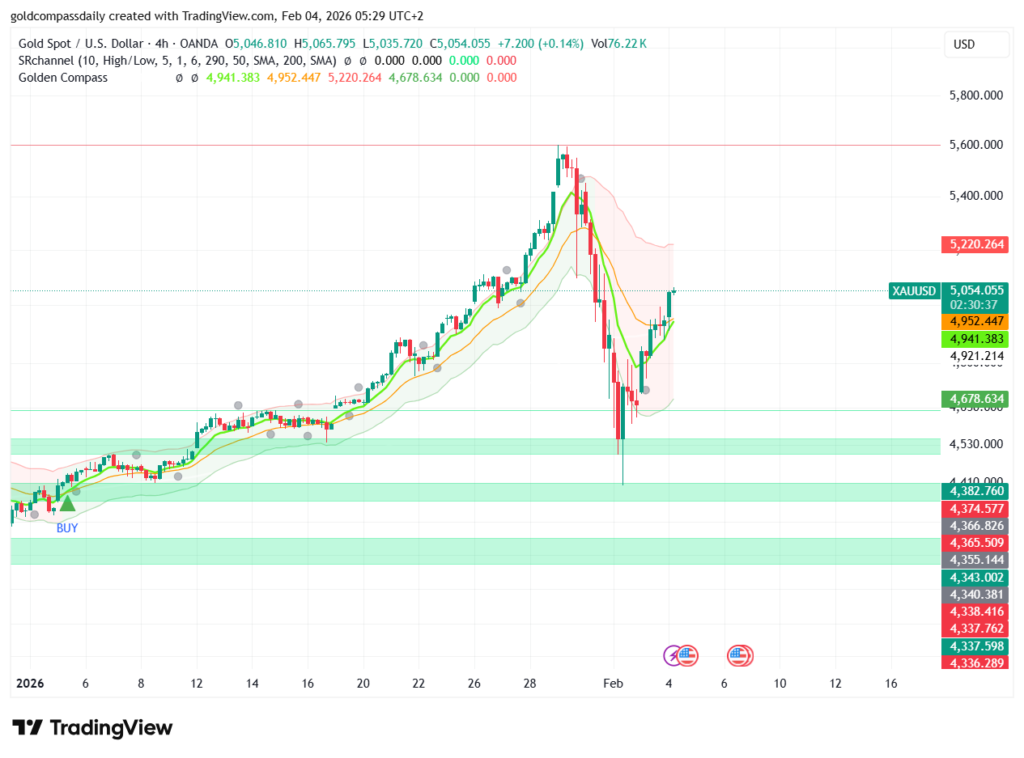
The first week of February 2026 has been a “baptism by fire” for precious metals. Following a record high near $5,602, gold suffered its steepest one-day drop since 1983, plummeting nearly 10%. However, as of February 4, 2026, the narrative has shifted from panic to profit. Gold has surged over 6% to reclaim the psychological $5,000 level. This Gold Price Analysis 2026 provides a comprehensive top-down look at why the bulls are charging back.
1. Macro Perspective: The “Warsh Shock” and Trade Thaw
The sudden volatility was triggered by a “perfect storm”: the nomination of hawkish Kevin Warsh as Fed Chair and a subsequent margin-call rout that flushed out “weak hands”. Despite this, the structural bull case remains. J.P. Morgan recently upgraded their year-end Gold Price Analysis 2026 forecast to $6,300, citing massive central bank diversification into real assets. Furthermore, a landmark US-India trade deal has eased energy purchase restrictions, providing a tailwind for broader global growth.
2. 4-Hour Analysis: Testing the “Line in the Sand”
On the 4-hour (H4) chart, gold is currently testing the 50-day EMA near $5,050. This “V-shaped” recovery is aggressive, but traders must watch for a potential “dead-cat bounce” if prices stay below the golden pocket at $5,200.
- Support: The $4,400 zone has established itself as the “dip of the decade” support level.
- Resistance: A breakout above the $5,153 – $5,208 zone is required to confirm that the correction is over.
Read more on the H4 strategy: Is the $5,000 Comeback for Real?
3. 1-Hour & 5-Minute Analysis: Scalping the Surge
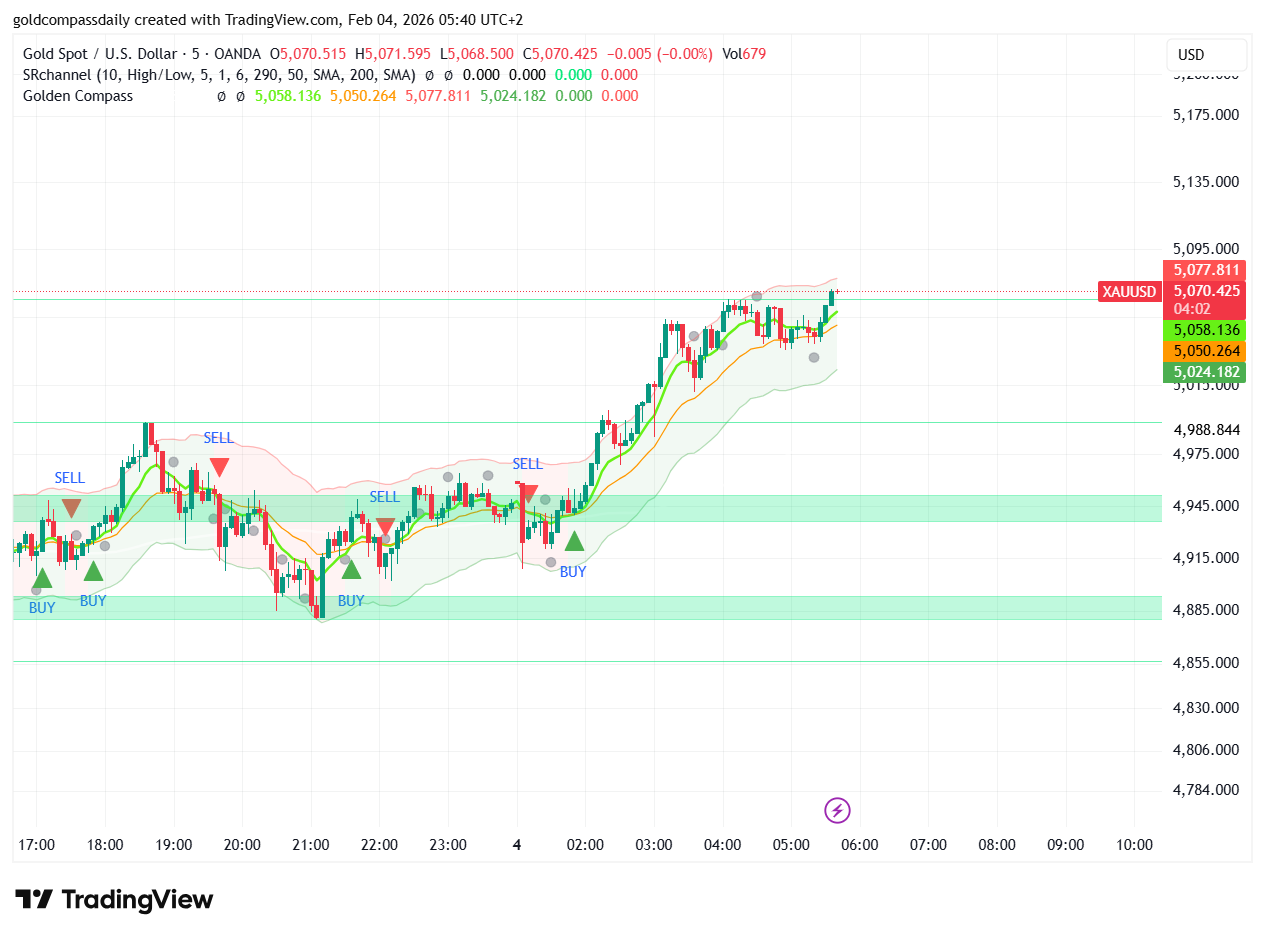
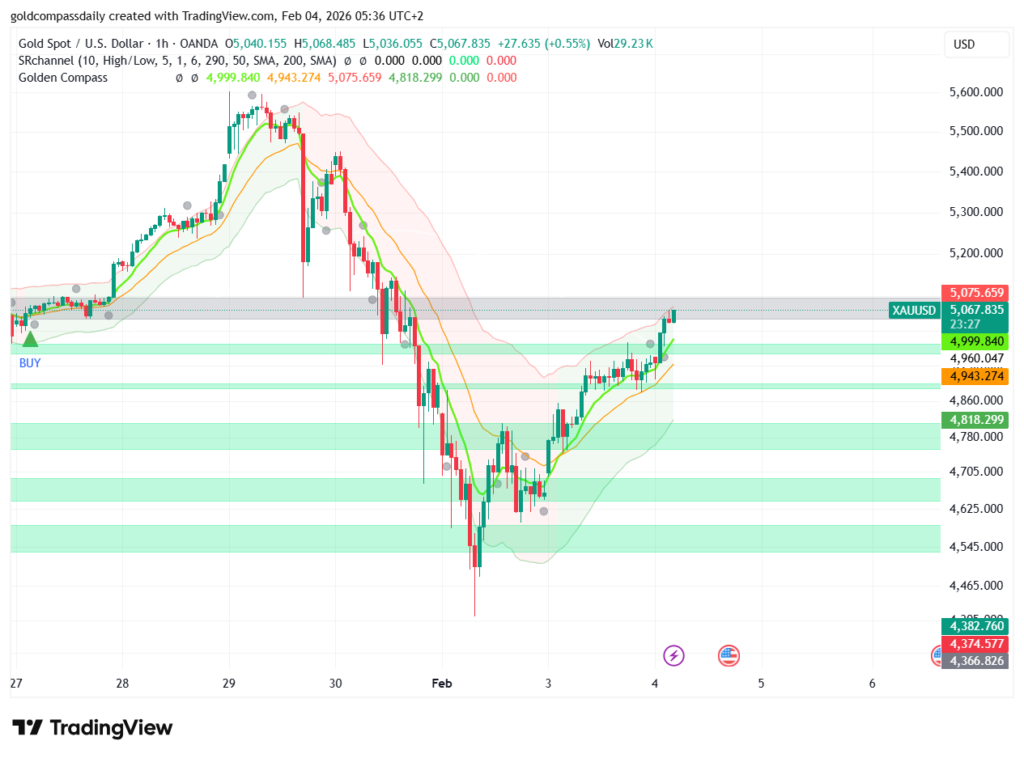
The intraday charts show a rapid mean-reversion move. On the 1-hour (H1) timeframe, gold has formed a bullish Marubozu, signaling intense buying pressure between $4,701 and $4,821. Scalpers on the 5-minute (m5) timeframe are using the $4,950 level as a pivot for “Buy the Dip” entries toward $5,050.
- Intraday Pivot: $4,930 remains the key intraday floor.
- Short-term RSI: Currently near 52, suggesting momentum is stabilizing but not yet overbought on the higher timeframes.
Deep dive into short-term levels: The $5,000 Rebound Is Underway and The $5,000 Battle & Trade Strategy.
Conclusion: The Bull Run Resumes
Today’s Gold Price Analysis 2026 reveals a market that has undergone a violent but healthy reset. While the $6,300 targets from major banks like J.P. Morgan and Deutsche Bank remain ambitious, the rapid reclamation of $5,000 proves that gold’s safe-haven appeal is far from dead. In a world of extreme volatility, gold continues to be the “ultimate insurance policy.”
Economic Calendar
Disclaimer
The content on Gold Compass Daily is provided for educational and informational purposes only. It does not constitute financial, investment, tax, or legal advice.