Gold Price Analysis 2026: The Critical Junction at $5,100
The global financial markets are holding their breath as the “yellow metal” faces its most significant test since the February crash began. After a staggering liquidation that wiped out billions in market cap, gold has staged a fast and furious recovery. However, the latest 4-hour technical data suggests that the euphoria might be meeting a brick wall. In this Gold Price Analysis 2026, we break down why the next 24 hours will decide the trend for the rest of the quarter.
The $5,100 Resistance: A Wall of Institutional Selling
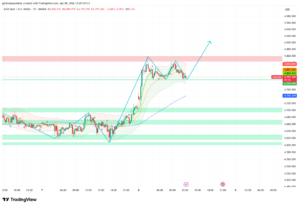
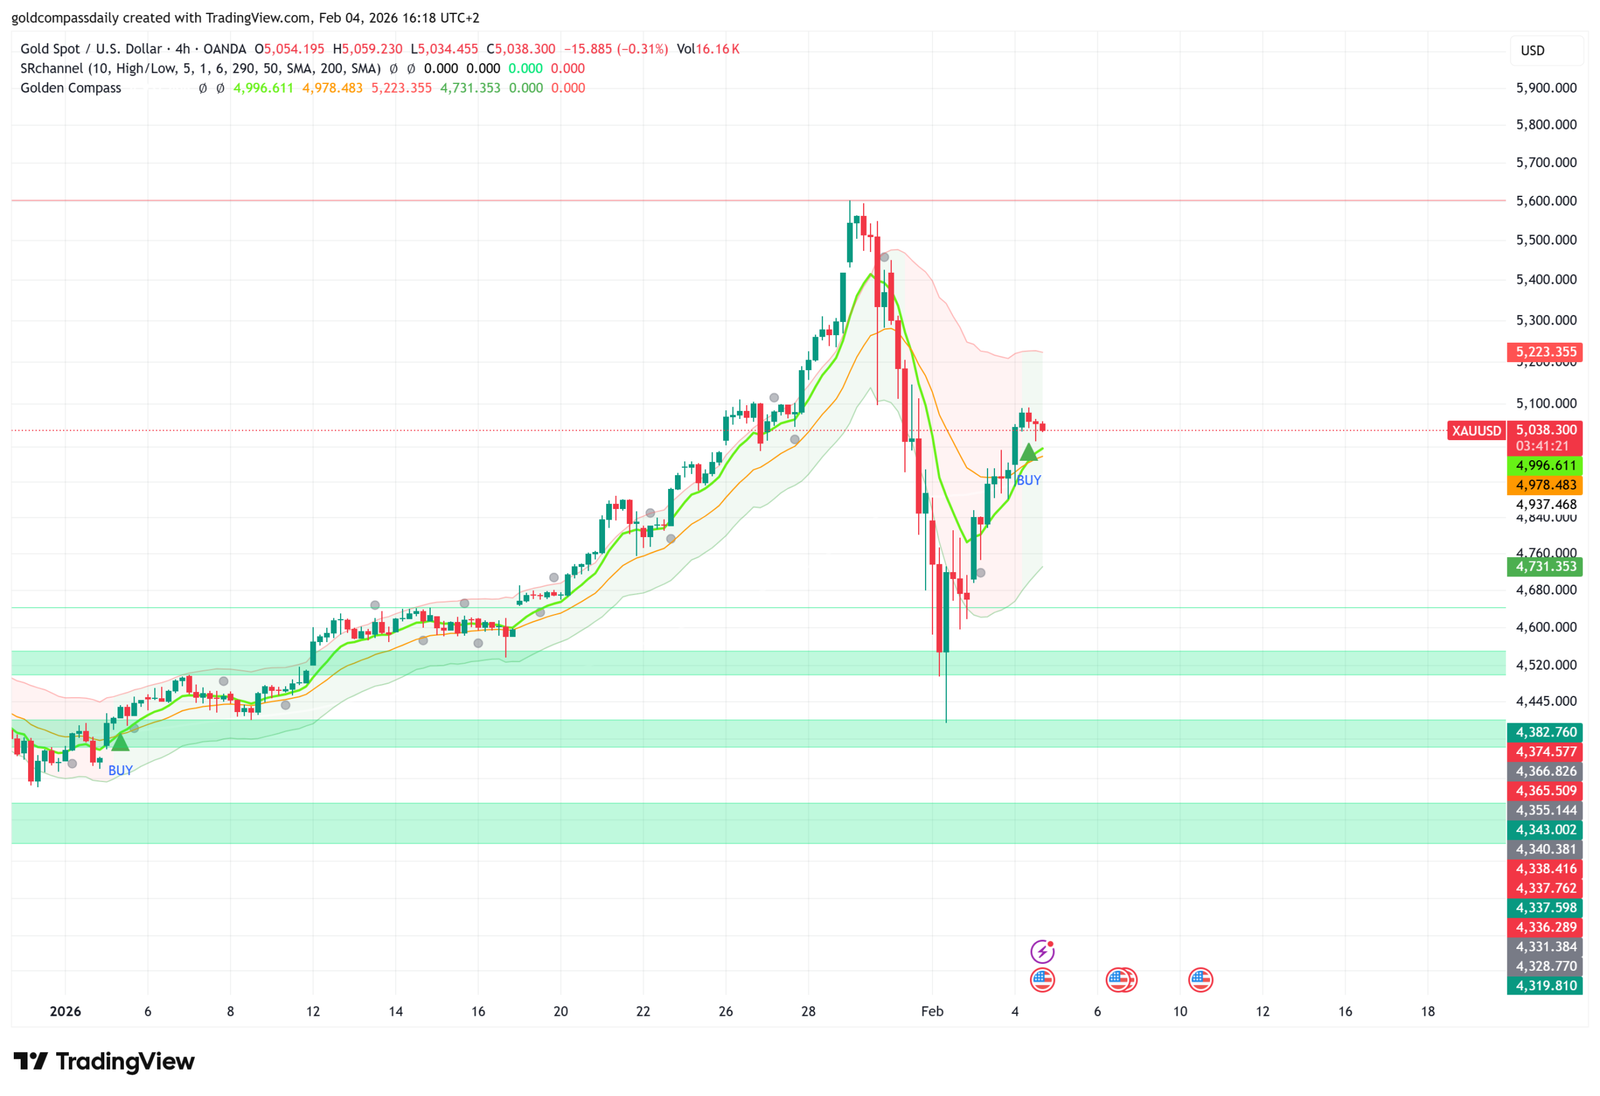
Looking at the 4-hour (4H) timeframe, the V-shape recovery from the $4,380 support zone has been nothing short of spectacular. Our “Golden Compass” indicator successfully identified the bottom, flashing a strong BUY signal that led to a $600 move. But as of February 4th, the momentum has stalled.
The price is currently battling a heavy supply zone between $5,080 and $5,120. This is not just a random number; it represents a “flipped” level where previous buyers became trapped during the initial crash. As the price returns to this level, these investors are “breaking even” and exiting their positions, creating massive selling pressure.
Technical Indicators: What the 4H Chart is Telling Us
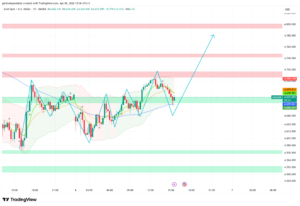
Despite the recent stall, the Gold Price Analysis 2026 remains cautiously optimistic for the long term. The 50-period SMA is beginning to curl upwards, and the price is holding steady above the $4,980 support band. This consolidation below resistance is often seen as “bullish flagging” – a period where the market builds energy for a breakout.
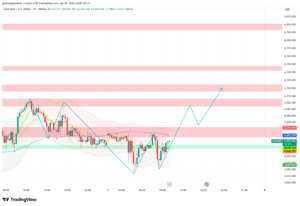
However, the RSI (Relative Strength Index) is showing signs of bearish divergence on smaller timeframes, suggesting that the buying power is exhausting. If the bulls fail to clear $5,150 with high volume, we could see a healthy retracement back to the $4,840 zone to retest the strength of the new buyers.
Market Sentiment: Beyond the Charts
For the average investor, the current price action is confusing. On one hand, central bank accumulation continues at record paces in 2026; on the other, the technical “scar tissue” from the recent $1,000 drop is making traders hesitant. We are seeing a classic battle between long-term fundamentals and short-term technical panic.
The “Golden Compass” volatility bands are widening, which usually precedes a massive move. Whether you are a conservative holder or an aggressive scalper, the $5,038 level is your current pivot point. A sustained trade below this will likely trigger another wave of algorithmic selling.
Strategic Trade Levels to Watch
- Bullish Scenario: A daily close above $5,125 targets a quick run to $5,300, followed by a re-test of the $5,500 psychological peak.
- Bearish Scenario: A failure to hold $5,000 will likely lead to a “double bottom” test near $4,730, providing a high-reward entry for long-term investors.
Conclusion: Buying Opportunity or Bull Trap?
The 2026 gold market is not for the faint of heart. While the recovery looks strong on paper, the resistance overhead is real. Our final verdict for this Gold Price Analysis 2026 is to wait for a confirmed breakout or a deeper retracement. Buying at the exact point of resistance is historically the most common mistake retail traders make.
Stay disciplined, watch the volume, and never trade without a stop-loss in this high-volatility environment.

Written by T. S. Gospodinov
T. S. Gospodinov is an Independent gold market analyst focused on liquidity structures and macro-driven price cycles.