
Gold Price Analysis 2026: Scalping the $5,000 Rebound
The gold market on February 4, 2026, has shifted from a state of total panic to a high-speed recovery. After Monday’s historic “flash crash” to $4,402, the yellow metal has staged its most aggressive one-day comeback since 2008, surging over 6%. This Gold Price Analysis 2026 focuses on the intraday 5-minute price action as gold fights to hold its ground above the psychological $5,000 milestone.
While long-term investors look at weekly trends, the 5-minute (m5) chart tells the story of institutional “dip-buying” and high-frequency trading (HFT) reactions to breaking news. Today’s rally is fueled by a mix of cooling Fed rate hike fears following Kevin Warsh’s nomination and fresh geopolitical safe-haven demand after US forces downed a drone in the Arabian Sea.
The 5-Minute Technical Blueprint
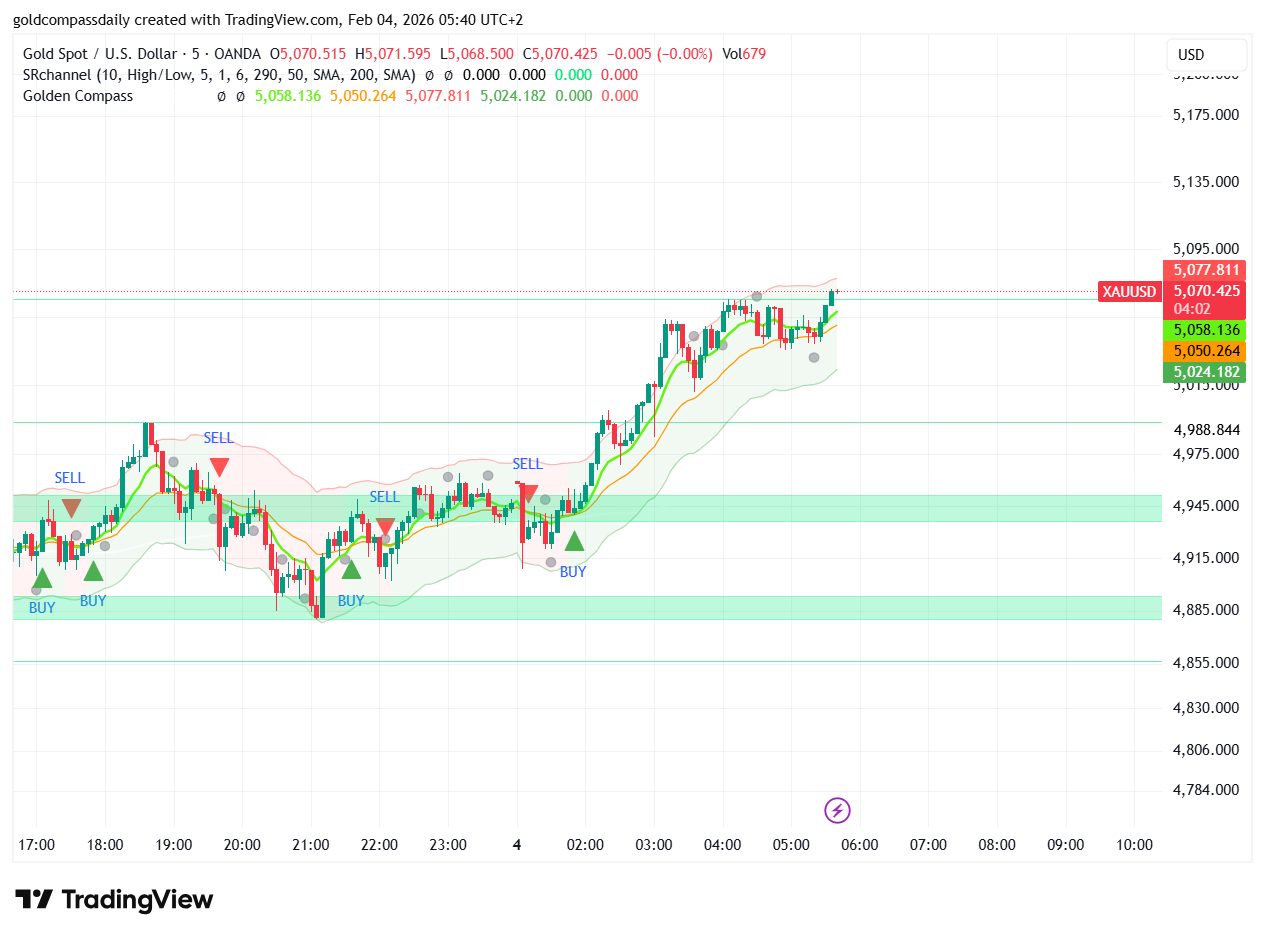
On the m5 timeframe, gold is exhibiting a classic “stair-step” recovery. After a period of extreme oversold conditions, the current price action is attempting to build a support base above the recent retracement hurdle of $4,858.
- Immediate Resistance: The $5,050 – $5,100 zone is the “line in the sand” for intraday bulls. A sustained 5-minute candle close above $5,052 could trigger a “short squeeze” toward the next structural target at $5,153.
- Scalping Support: Intraday support has formed near the $4,950 level. If the m5 trend breaks below $4,821, traders should brace for a potential retest of the $4,760 area.
- Momentum Indicators: Short-term oscillators like the RSI(14) are currently showing “overbought” readings near 71, suggesting a brief period of sideways consolidation or a minor pullback to $4,930 is likely before the next leg up.
Why Volatility is the New Normal
As part of our Gold Price Analysis 2026, we must acknowledge that intraday swings of $50–$100 are currently common. This volatility is exacerbated by the CME Group’s recent decision to raise margin requirements, which has “thinned out” the market and made price movements more explosive.
Despite the chaos, the underlying fundamentals remain historically strong. Central banks are continuing their record-breaking accumulation, with J.P. Morgan maintaining a long-term target of $6,300. On a 5-minute scale, this means that “selling the rip” has become increasingly dangerous as deep-pocketed buyers wait for any sign of a pullback.
Intraday Trading Strategy
For today’s session, the most effective strategy involves “Buy the Dip” entries near the 5-minute EMA clouds.
- Bullish Confirmation: Watch for a breakout above $5,080 on high volume. This signals that the “V-recovery” is accelerating.
- Risk Management: Use tight Stop Losses near $4,789 for any long positions, as the market remains sensitive to any further news regarding the US government shutdown or Fed commentary.
Conclusion: Staying Agile in a Golden Recovery
Today’s Gold Price Analysis 2026 proves that gold has not lost its shine; it has simply undergone a violent reset. The reclamation of $5,000 is a massive win for bulls, but the m5 chart warns of a volatile struggle at current levels. Whether you are a scalper or a long-term holder, the “dip of the decade” appears to have found its floor, setting the stage for a new rally toward historic highs.

Written by T. S. Gospodinov
T. S. Gospodinov is an Independent gold market analyst focused on liquidity structures and macro-driven price cycles.


