Gold Price Analysis 2026: The H1 Battle for $4,800
The first trading days of February 2026 have been nothing short of historic for gold. After a parabolic rise that defied all expectations, the market suffered a “Black Friday” style liquidation, dropping from $5,597 toward the $4,404 mark—the lowest level since early January. As we enter the New York session on February 3, our Gold Price Analysis 2026 focuses on whether this is a “dead cat bounce” or the start of a massive $5,000 recovery.
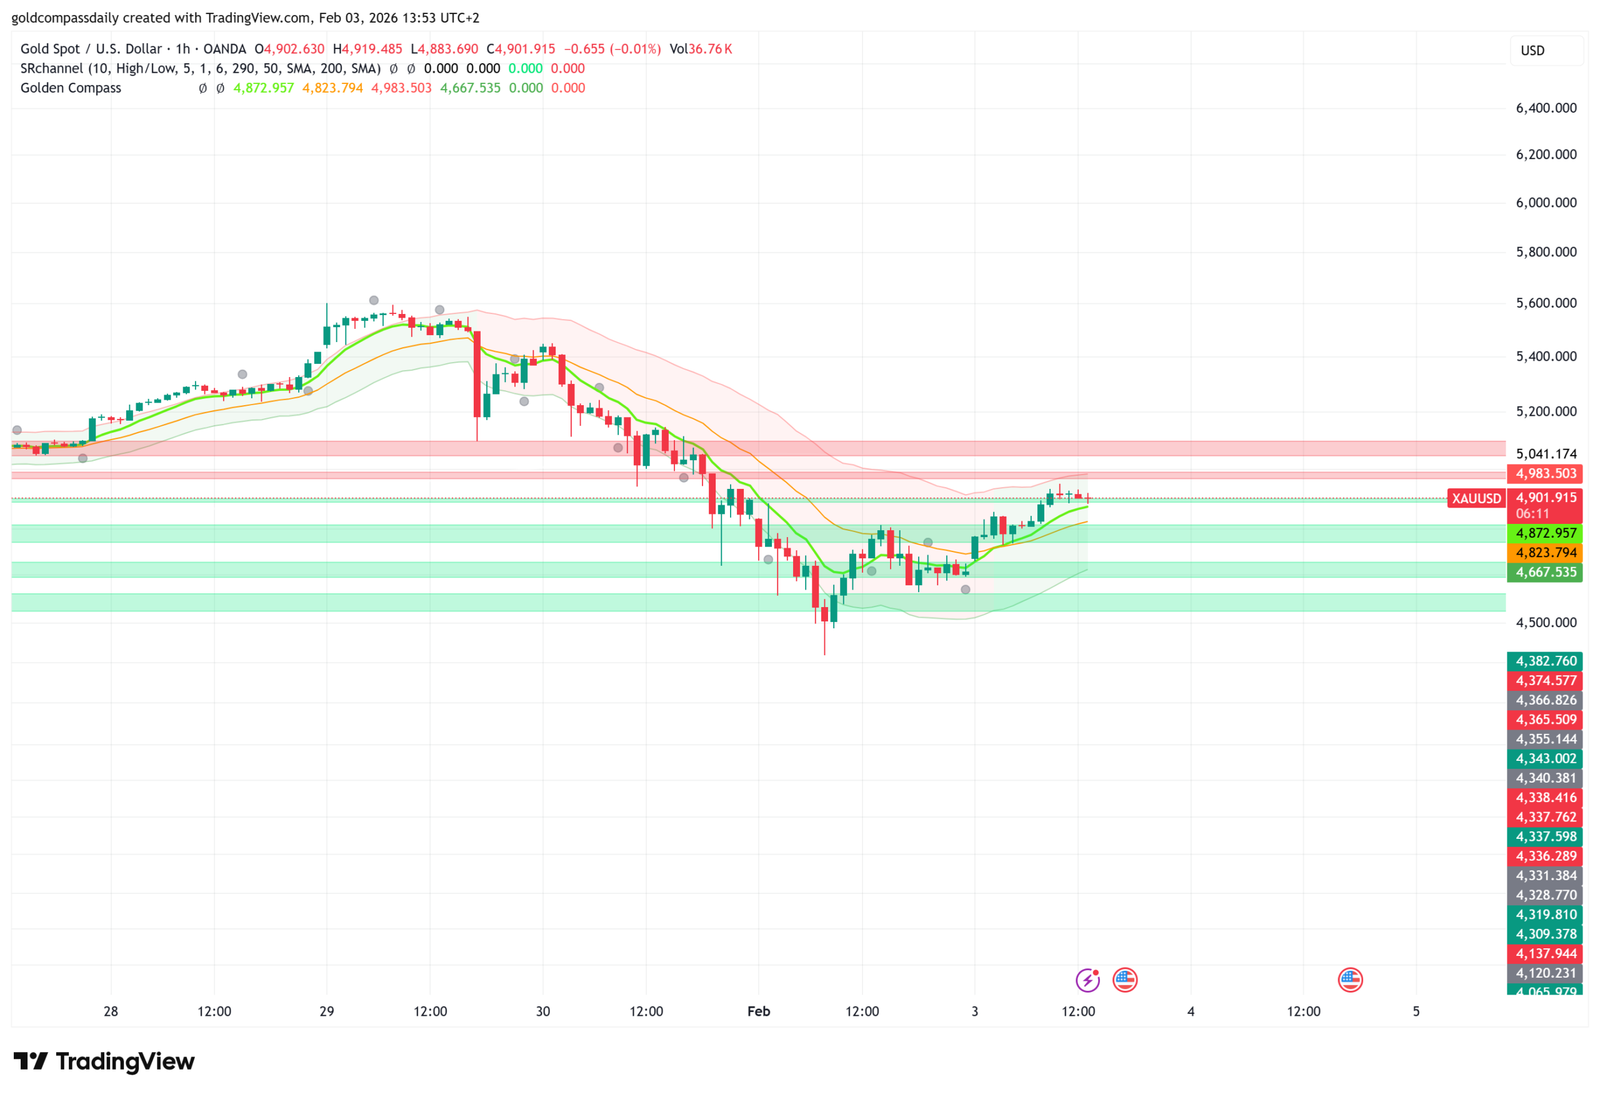
Currently, the hourly (H1) chart shows gold attempting to stabilize. The sharp vertical drop has been replaced by a cautious consolidation as traders look toward the 10:00 AM ET US JOLTS Job Openings report and key speeches from FOMC members Michelle Bowman and Thomas Barkin. These events are the ultimate “judge and jury” for the US Dollar’s strength and, by extension, gold’s immediate future.
H1 Technical Outlook: Consolidation or Breakout?
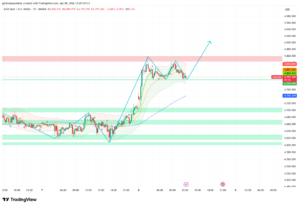
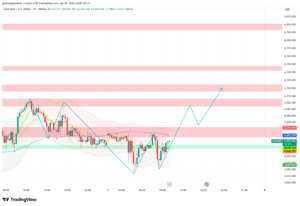
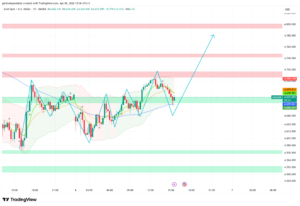
Technically, the H1 chart is in a precarious position. The price is currently trading between a tight range of $4,750 and $4,860. While the RSI (Relative Strength Index) has crawled out of “extreme oversold” territory, it remains below the neutral 50 level, suggesting that sellers are still lurking in the shadows.
Traders should watch the following levels closely on the 1-hour timeframe:
- Immediate Resistance ($4,858 – $4,921): Reclaiming the $4,921 handle is essential for bulls to prove this rally has legs.
- Key Pivot Zone ($5,000): This psychological level is the gateway to the $5,200 recovery target. A failed break here could trigger a secondary wave of selling.
- Major Support ($4,400 – $4,460): This is the “floor” of 2026. A breach below $4,400 could open the trapdoor to a deeper crash toward $4,000.
Fundamental Triggers: JOLTS and the Fed
The reason for the current high-stakes environment in our Gold Price Analysis 2026 is the shift in US labor demand. The JOLTS report is forecast to show 7.21 million openings. A higher-than-expected number would suggest a robust US economy, giving the Fed more room to keep rates elevated—a scenario that is traditionally “kryptonite” for gold.
Furthermore, the markets are listening for “hawkish” tones from Fed Governor Bowman. If she hints at delaying rate cuts due to “reflationary” concerns, we could see gold give back its recent H1 gains and retest the $4,500 zone. Conversely, any sign of labor market “fragility” could provide the jet fuel needed for a rally back toward $5,000.
Why Institutional Targets Still Point to $4,900
Despite the recent carnage, giants like Goldman Sachs and Deutsche Bank maintain aggressive long-term targets. Deutsche Bank recently increased its average price forecast to $4,450, viewing the current range as a stabilization period. They argue that central bank demand and geopolitical tensions in regions like Venezuela and the Middle East provide a permanent “safety floor” for the market.
Conclusion: Navigating the Hourly Volatility
The Gold Price Analysis 2026 suggests that while the long-term trend is struggling, the H1 chart is offering prime opportunities for “scalpers” and day traders. The $4,800 level is the current battleground. If gold can close the day above its 20-period hourly moving average, we may have seen the bottom. If not, buckle up for a volatile retest of the yearly lows.

Written by T. S. Gospodinov
T. S. Gospodinov is an Independent gold market analyst focused on liquidity structures and macro-driven price cycles.