As of February 9, 2026, gold prices are making headlines with a strong rebound, trading around $5055–$5070 per ounce. The XAU/USD pair has climbed over 1.8% today, reaching highs near $5080, driven by a mix of softer U.S. yields, a weaker dollar, and renewed safe-haven demand. For everyday investors curious about adding gold to their portfolio, and for active traders seeking actionable insights, this gold price analysis breaks down the latest 1-hour chart action, fundamental drivers, and potential moves ahead. Whether you’re hedging against inflation or scalping intraday volatility, understanding these trends can help navigate the “2026 gold rush.”
Current Gold Price Analysis Overview
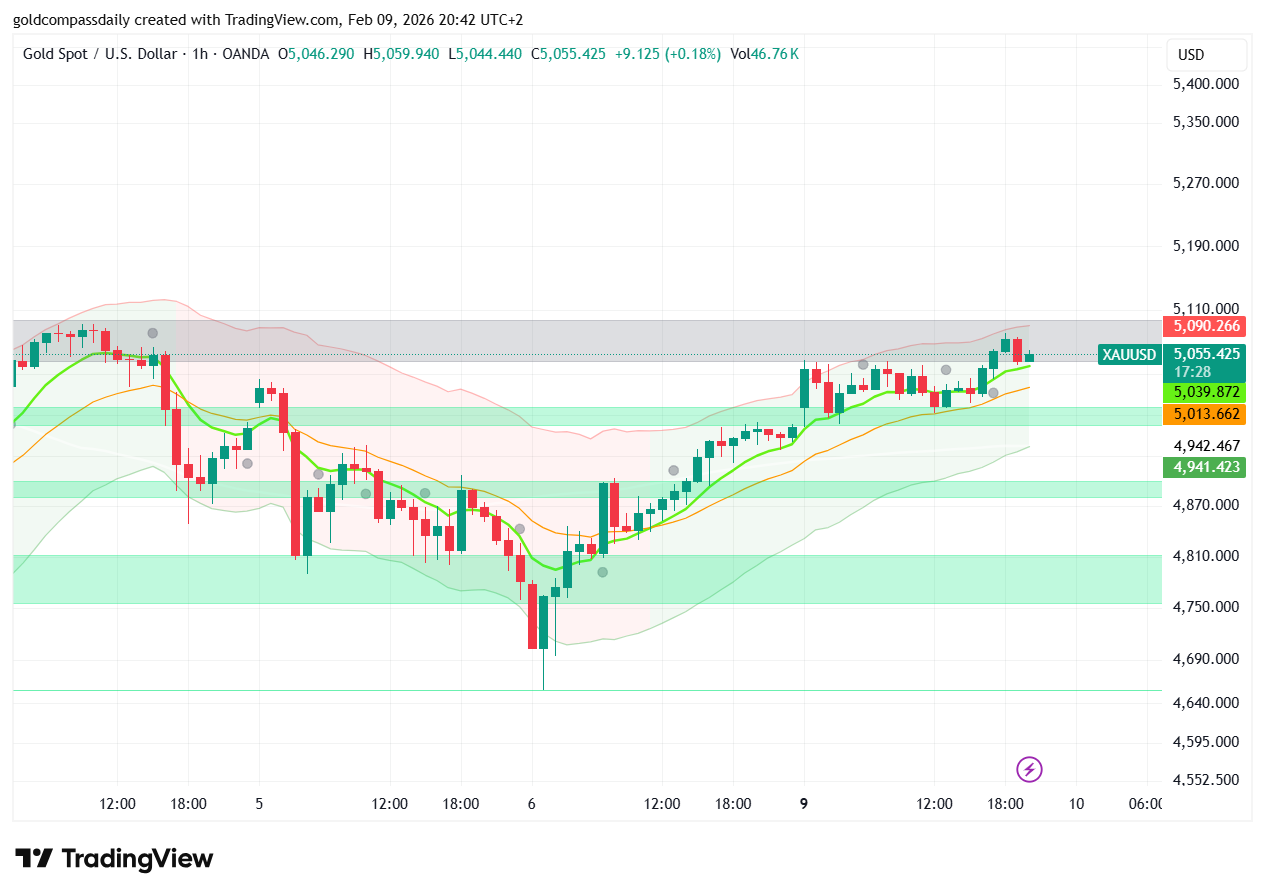
The spot gold price opened the week on a bullish note, recovering from early February lows around $4960–$4990. By mid-morning UTC, XAU/USD has surged to approximately $5055.425, with a daily high of $5059.940 and low of $5044.440, reflecting a +0.18% gain on the last close but broader session gains exceeding 1.5–2%. Volume stands at 76K, indicating solid participation amid key economic anticipation. This movement aligns with global forecasts, where analysts like those at Trading Economics project gold at $5021 by quarter-end, potentially climbing to $5347 in a year.
For non-experts, gold acts as a “financial safety net” – its value often rises when stocks dip or geopolitical tensions flare. Right now, with U.S. data like NFP and CPI on the horizon, prices are volatile but upward-biased, making it an attractive option for diversifying savings without deep market knowledge.
Technical Breakdown: The 1-Hour Chart Insights
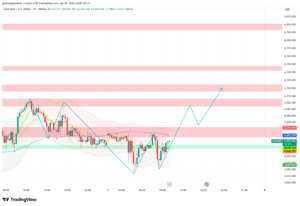
Examining the 1-hour TradingView chart for XAU/USD, we see a resilient uptrend within an SR Channel, supported by moving averages. The session began with consolidation around $5050–$5100 from prior days, followed by a sharp pullback to $4941–$4947, marked by a series of red candles testing the lower channel boundary. This support held, leading to a bullish reversal with strong green candles pushing prices back above the 50-period SMA at ~$5036.
Key technical levels include:
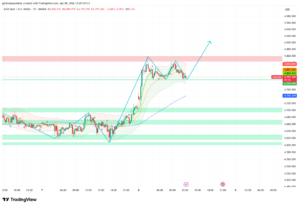
- Resistance ($5059–$5080): This zone has capped gains today, with repeated rejections visible. A break above could target $5100–$5128, aligning with the Golden Compass upper band at $5090.266.
- Support ($5044–$4947): The pivot low here acts as a “line in the sand.” Holding this prevents a deeper correction toward $4900, while a bounce confirms bullish continuation.
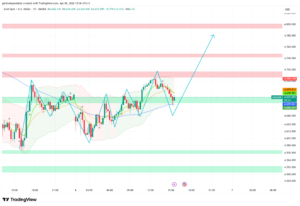
- Moving Averages: The 200-period SMA at ~$5000 provides long-term support, with shorter MAs (10, 50) trending upward, signaling accumulating momentum. RSI indicators (implied) show divergence, hinting at possible overbought conditions if the rally extends without pause.
The chart exhibits a “V-shaped” recovery pattern, common in precious metals during risk-off sentiment. For beginners, this means the market dipped to shake out weak sellers before climbing higher – a healthy sign for potential rallies.
Fundamental Drivers Influencing Gold Prices
Fundamentally, gold’s surge is fueled by the nomination of Kevin Warsh as Fed Chair, seen as hawkish but paradoxically boosting gold via dollar weakness. Warsh’s inflation-fighting stance has raised yields, yet markets anticipate dovish pivots if U.S. data softens. Upcoming catalysts like the January NFP jobs report and CPI inflation data this week could spike volatility – strong jobs might strengthen the USD and pressure gold, while weak figures could propel it toward $5100+.
Global demand remains a pillar: China’s central bank extended its buying streak to 15 months, adding reserves amid currency concerns. Geopolitical floors, including Middle East tensions and U.S. tariffs, further support prices. Analysts from JPMorgan and Deutsche Bank forecast $6000+ by year-end, citing fiscal deficits and central bank hoarding. For average readers, this means gold isn’t just speculative – it’s a hedge against economic uncertainty, ideal for long-term holdings like ETFs or physical bars.
Trading Strategy: Navigating the Volatility
For traders, the 1-hour chart offers clear setups. Scalpers can buy dips near $5044 support with tight stops below $4947, targeting $5059–$5080 for quick profits. Swing traders should monitor a sustained break above $5080 for longs toward $5128, using 1–2% risk per trade. Conversely, if support fails, shorts could aim for $4900 with caution ahead of data releases.
Non-traders might opt for passive strategies: Dollar-cost average into gold funds if prices pull back below $5000, betting on the bull market’s continuation. Market psychology favors optimism post the January 16–18% correction from $5608 highs – this “reset” has cleared speculative excess, paving the way for institutional accumulation.
Conclusion: Bullish Bias with Caution
This gold price analysis highlights a market in rebound mode, with the 1-hour chart suggesting more upside if resistances break. While short-term risks from U.S. data loom, fundamentals like central bank buying and safe-haven appeal keep the long-term outlook positive through 2026. Stay patient, monitor $5050–$5080 levels, and avoid overtrading in volatile sessions.
Gold remains a timeless asset – whether for wealth preservation or active plays, its current trajectory offers opportunities for all.

Written by T. S. Gospodinov
T. S. Gospodinov is an Independent gold market analyst focused on liquidity structures and macro-driven price cycles.