Technical View: The $5,000 Tug-of-War
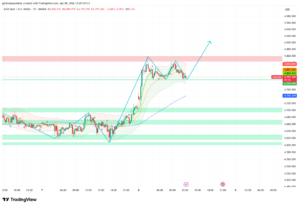
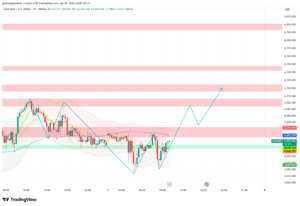
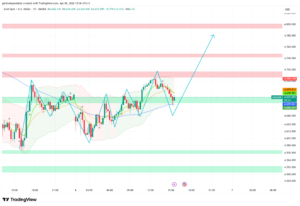
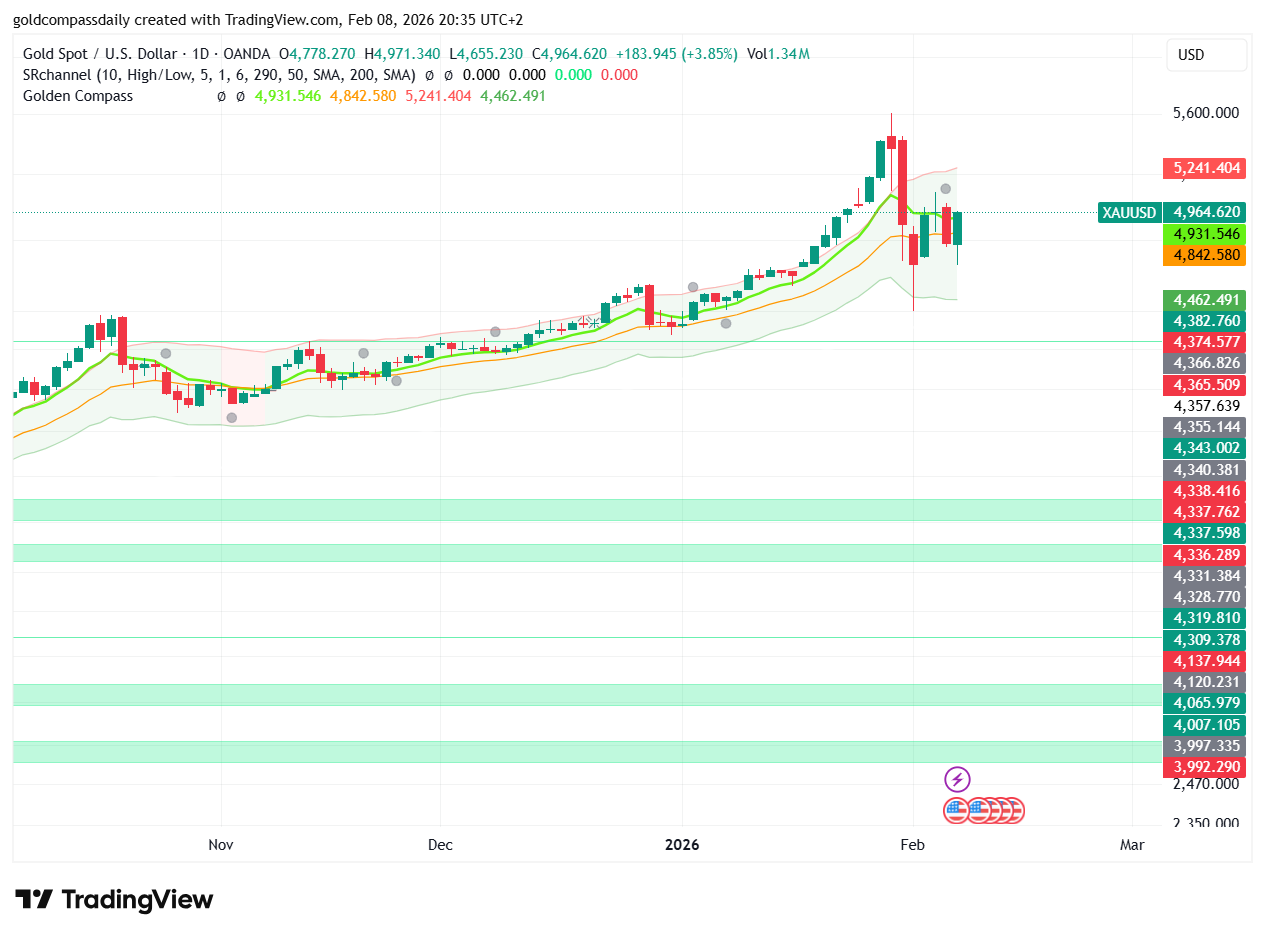
On the daily chart, gold is currently trapped in a high-stakes range. Technical indicators provide mixed signals as the market digests the 14% year-to-date surge and the subsequent 9% “flash crash”.
- The Support Floor ($4,701): This is the most critical level for bulls to defend this week. A daily close below this mark could invalidate the recovery and open the door to a deeper correction toward $4,441.
- The Resistance Ceiling ($4,937 – $5,000): Reclaiming the $5,000 psychological barrier is essential for restoring market confidence. Analysts note that as long as prices stay below $4,955, the immediate bias remains neutral-to-bearish.
- Cycle Convergence: Current technical data suggests a “triple-cycle convergence” in mid-February, which historically precedes extreme volatility and potential trend reversals.
Fundamental Drivers: CPI and the “Hawkish” Fed
This week’s Gold Price Analysis is heavily influenced by upcoming U.S. macroeconomic data. Markets are bracing for January’s CPI (Consumer Price Index) report, which will likely dictate the Federal Reserve’s next move regarding interest rates.
Earlier this month, the nomination of Kevin Warsh as Fed Chair sent gold prices into a tailspin, as he is viewed as a “hawk” who may favor higher rates for longer to combat persistent inflation. Because gold does not generate interest, higher real yields in the U.S. typically make the metal less attractive to institutional investors.
The Bull Case: Central Banks and Geopolitics
Despite the short-term volatility, the long-term outlook for 2026 remains overwhelmingly bullish. Institutional giants like J.P. Morgan and Wells Fargo maintain their year-end targets of $6,100 to $6,300 per ounce.
- Reserve Diversification: Global central banks, led by China and Poland, continue to favor gold over the U.S. dollar as a neutral reserve asset.
- Structural Risk Premium: Trade fragmentation and escalating global diplomacy through unconventional channels have made geopolitical risk a permanent feature of asset pricing in 2026.
Strategic Outlook: What to Watch This Week
As we navigate the second week of February, the primary Gold Price Analysis objective is to watch for “consolidation.” After moves of this magnitude, markets often need time to build a durable bottom.
Critical Levels to Monitor:
1. **Upside Target ($5,153):** A break above this daily high would signal that the “flash crash” sellers have been exhausted.
2. **Downside Danger ($4,538):** This level aligns with the 50-day moving average and the primary bullish trendline; a sustained break here would put the entire 2026 bull market at risk.
Conclusion: Patience Over Panic
While the recent price erosion has been painful for late-entry buyers, the fundamental case for gold—sovereign debt, central bank demand, and inflation hedging—is still firmly in place. This week, the most profitable “trade” may be strategic patience as the market waits for the CPI data to clear the smoke.

Written by T. S. Gospodinov
T. S. Gospodinov is an Independent gold market analyst focused on liquidity structures and macro-driven price cycles.