
The precious metal markets are currently witnessing a significant Gold Price Correction as XAU/USD retreats from its recent parabolic rally. After touching unprecedented highs near the $5,600 mark, the 4-hour chart reveals a sharp change in market sentiment, characterized by a series of bearish engulfing candles and a breakdown of immediate support structures.
Technical Breakdown: The 4-Hour Momentum Shift
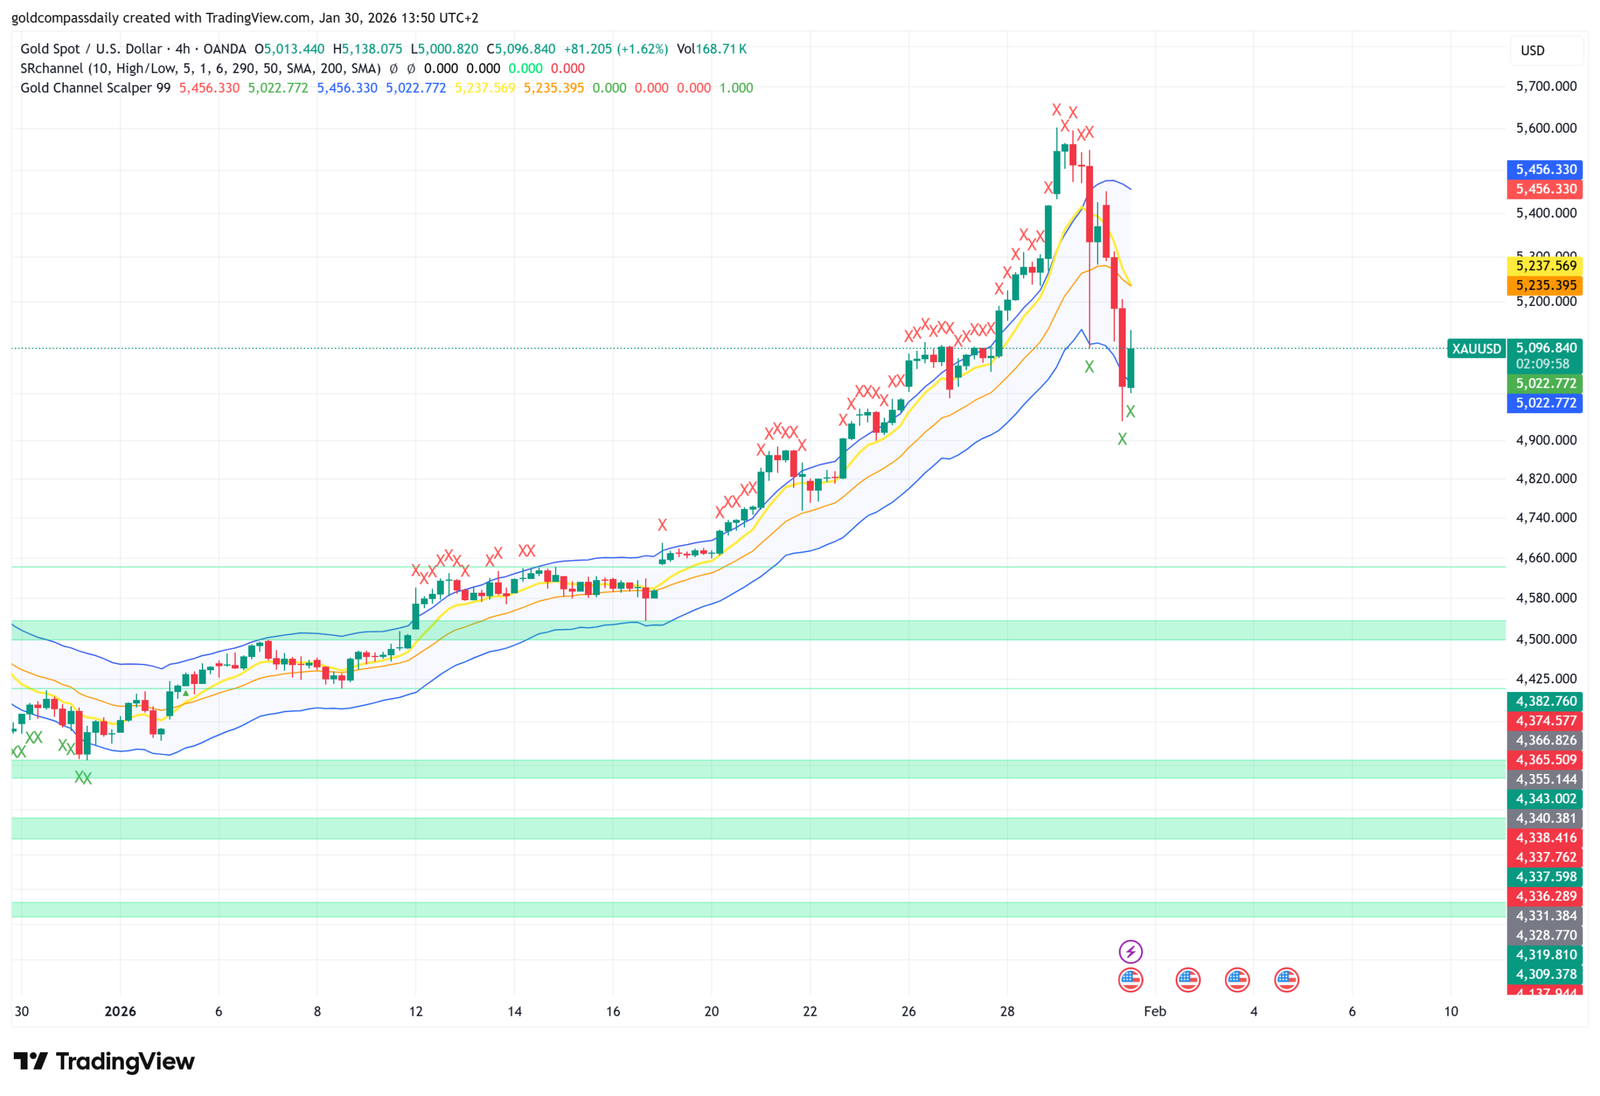
Looking at the technical indicators on the 4-hour timeframe, the Gold Price Correction became evident following a classic “exhaustion” pattern. The price had extended well beyond the upper boundaries of the Gold Channel Scalper 99, leading to an inevitable mean reversion. The current price action is trading below the yellow signal lines, which historically suggests that the short-term trend has shifted from bullish to corrective.
The 4-hour chart shows that the price is currently testing a critical psychological and technical junction. The velocity of the drop indicates that profit-taking has turned into a broader liquidations event, fueled by changing macroeconomic expectations and a stabilizing US Dollar.
Key Support and Resistance Levels
During a Gold Price Correction, identifying where the “floor” might be is essential for both swing traders and scalpers. Based on the current chart structure, here are the levels to watch:
- Immediate Support: The $5,022 – $5,096 zone. This area represents previous consolidation and is the first line of defense for bulls.
- Major Structural Support: The $4,500 – $4,580 horizontal green band. If the correction deepens, this is the primary target for a long-term bottom.
- Immediate Resistance: The $5,235 – $5,456 range. Any relief rally must reclaim these levels to invalidate the bearish outlook.
Fundamental Triggers Behind the Sell-off
While the technicals screamed “overbought,” the fundamental catalyst for this Gold Price Correction can be traced back to the latest economic data. The recent US PPI and GDP figures have provided the Federal Reserve with more room to maintain a restrictive policy, dampening the non-yielding metal’s appeal. Additionally, geopolitical risk premiums that were baked into the $5,600 peak are starting to erode as diplomatic efforts stabilize.
Market participants are now recalibrating their expectations for interest rate cuts in 2026. As real yields begin to firm up, the opportunity cost of holding gold increases, adding further downward pressure on the XAU/USD pair.
Trading Strategy: How to Play the Correction
Navigating a Gold Price Correction requires patience and strict risk management. For traders looking at the 4-hour chart, the current environment favors a “sell the rally” approach until a clear reversal pattern—such as a double bottom or a bullish divergence on the RSI—forms near major support.
Conservative traders should wait for the price to stabilize around the $5,000 level. A confirmed bounce with high volume at this psychological support could offer a high-probability entry for the next leg up. Conversely, a daily close below $5,000 could accelerate the slide toward the $4,600 area, marking a deeper retracement of the 2025-2026 bull run.
Conclusion
The current Gold Price Correction is a healthy part of a long-term bull market. By flushing out over-leveraged long positions, the market creates a more sustainable foundation for future growth. Monitor the 4-hour close relative to the $5,096 level; this will likely dictate the price direction for the upcoming sessions. Stay disciplined and keep your stops tight as volatility remains at elevated levels.

Written by T. S. Gospodinov
T. S. Gospodinov is an Independent gold market analyst focused on liquidity structures and macro-driven price cycles.


