
Gold Price Crash: Analyzing the 5-Minute “Flash” Rebound
The global precious metals market is currently navigating a period of historic instability. On February 6, 2026, a sudden Gold Price Crash saw bullion plummet nearly 4% in a single session, testing the psychological floor at $4,750. For the general public, this move looks like a collapse. For professional institutions, however, this vertical drop represents a “liquidity hunt”—a mechanical flush of leveraged positions before a potential structural trend reversal.
As of this afternoon, the market is on a hair-trigger. We are currently seeing a “dead cat bounce” or a legitimate reversal forming on the 5-minute chart as investors weigh the impact of a surging US Dollar against record-high margin requirements set by the CME Group.
The Anatomy of the Dump: Why 4750 Matters
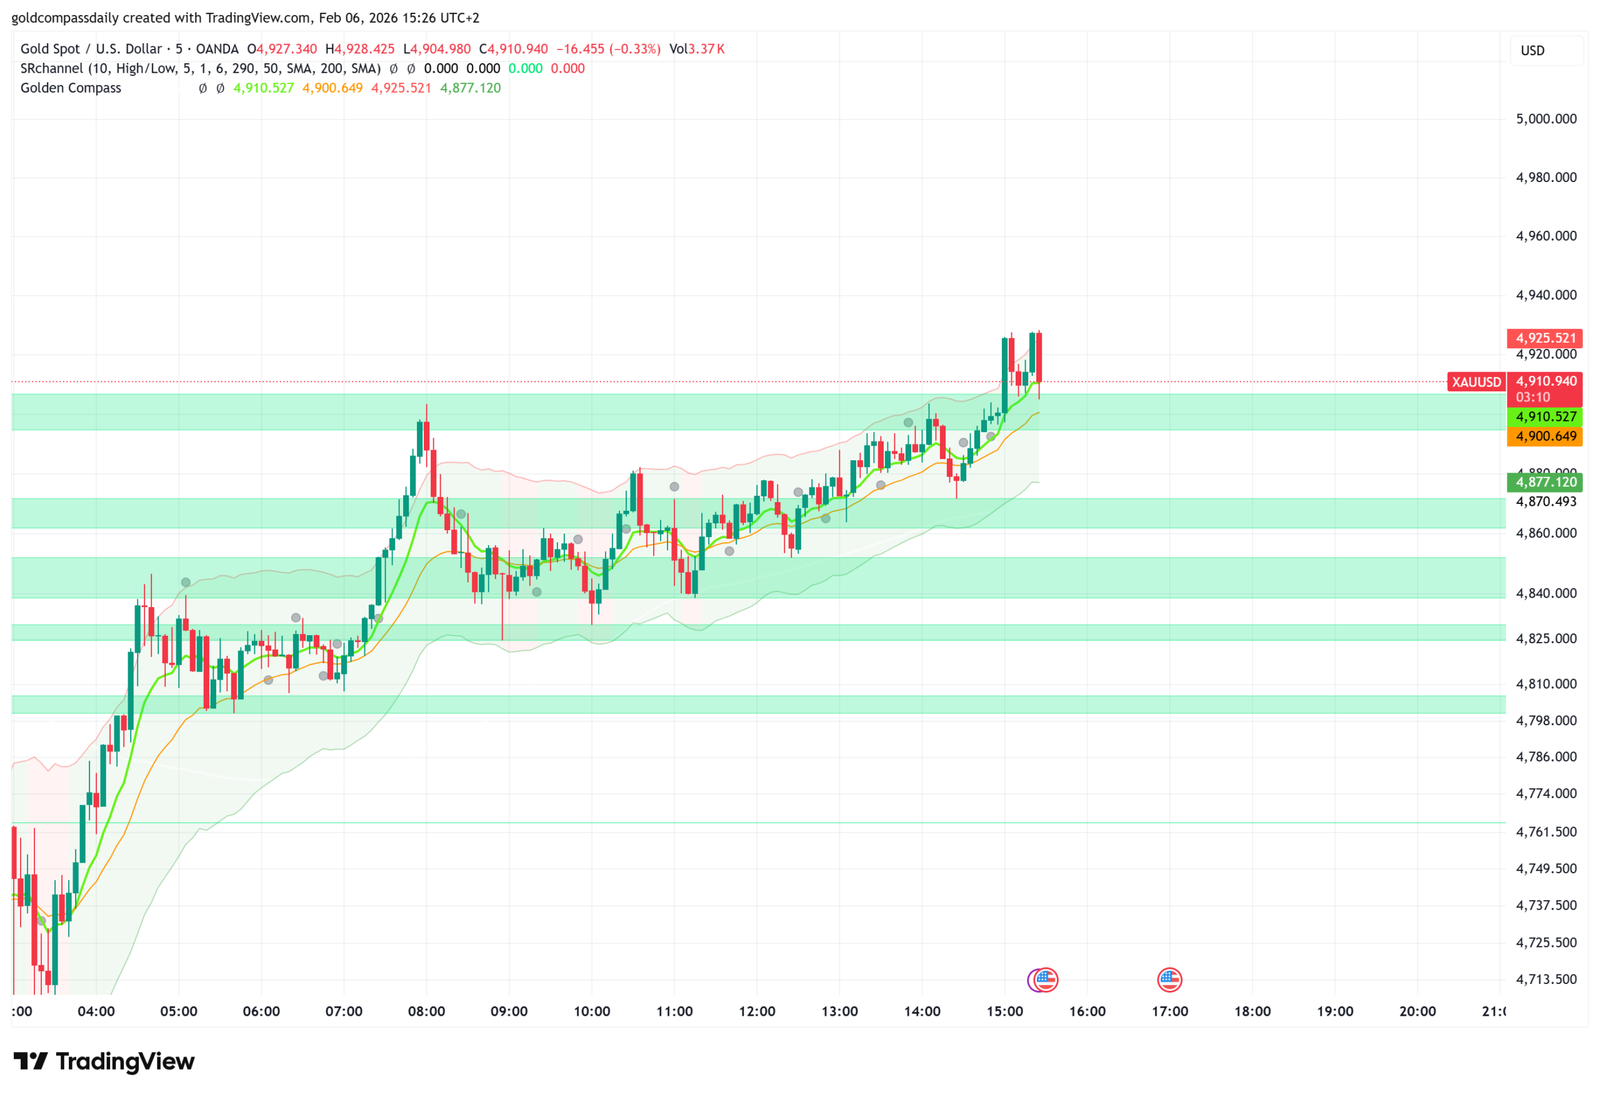
The 5-minute chart provides a microscopic look at the panic. As the Gold Price Crash accelerated, it sliced through the 200-period moving average with extreme volume, leaving many retail traders “trapped” at higher levels.
- Immediate Support ($4,750): This level is the “line in the sand.” Buyers successfully defended this zone during the London session, creating a double-bottom pattern that suggests short-term exhaustion from the bears.
- The “Margin Call” Catalyst: A major driver of today’s volatility was the forced liquidation of positions to meet margin requirements following massive losses in equities and silver.
- Oversold RSI: Technical indicators show the 5-minute RSI dipped into the “Extreme Fear” zone below 20. Historically, such levels on this timeframe precede a sharp “snap-back” rally toward the $4,850 level.
Economic Triggers: US Consumer Sentiment in Focus
The Gold Price Crash is not happening in a vacuum. At 5:00 PM (UTC+2), the Preliminary Michigan Consumer Sentiment report will be released. This “red folder” event is expected to show a decline to 55.0.
For the broader audience, this means the price swings you see are a reaction to fear. If the US data comes in weaker than expected, it could weaken the US Dollar and give gold the “buying firepower” it needs to reclaim $4,900. However, a stronger-than-expected reading could turn this minor relief rally back into a downward spiral.
Strategic Forecast: Rebound or Reversal?
Despite the frightening headlines, many institutional forecasts remain bullish for the rest of 2026. JP Morgan analysts recently projected gold reaching $6,300 by year-end, suggesting today’s Gold Price Crash may be a generational entry point for long-term investors.
Levels to Watch Now:
1. **The Bounce Zone ($4,872):** Reclaiming this level on the 5-minute timeframe is the first sign that the bulls are regaining control.
2. **The Danger Zone ($4,700):** A sustained hold below the recent lows would confirm a technical bear market, potentially targeting the $4,441 range next week.
Conclusion: Don’t Panic, Plan
Today’s Gold Price Crash is a reminder that the market is a master of deception. While the 5-minute chart looks like a disaster to the untrained eye, the structural drivers—central bank demand and global debt concerns—remain intact for 2026. Stay disciplined, watch the support at $4,750, and remember: the biggest opportunities often come wrapped in the scariest charts.

Written by T. S. Gospodinov
T. S. Gospodinov is an Independent gold market analyst focused on liquidity structures and macro-driven price cycles.


