Gold Price Crash: Analyzing the 1-Hour Market Pivot
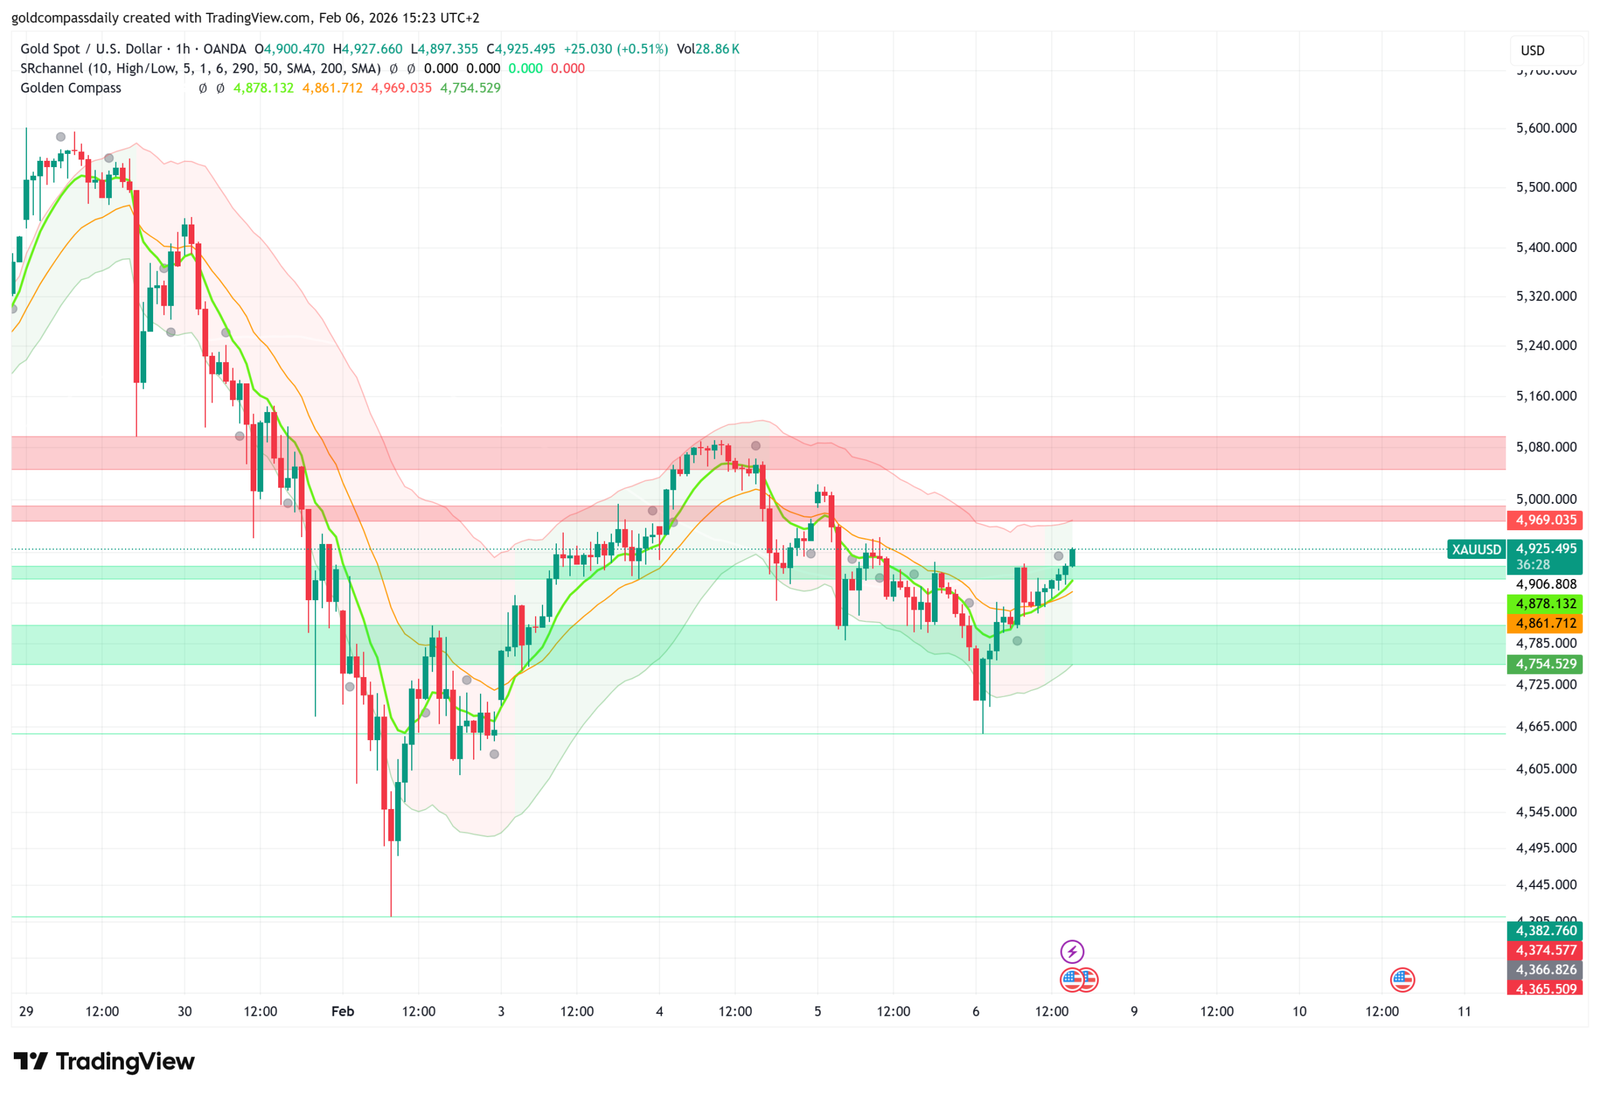
The global gold market is currently navigating one of its most volatile periods in years. On February 6, 2026, a sudden Gold Price Crash saw the metal spiral from record highs above $5,500 down toward the $4,800 psychological floor. For the general public, this move looks like a collapse. For institutional traders, however, the 1-hour chart suggests a “liquidity hunt” designed to flush out speculative capital before a potential structural rebound.
As of today, the market is in “choppy” territory, struggling to reclaim its year-to-date gains as investors weigh a surging US dollar against cooling labor data. Whether you are a retail investor or a professional trader, the 1-hour chart is currently flashing “Neutral” signals, waiting for a catalyst to define the next major leg.
Technical Breakdown: The Battle for $4,825
Looking at the hourly timeframe, the Gold Price Crash has pushed XAU/USD into a critical demand zone. The speed of the decline was accelerated by a 9% hike in metal futures margins from the CME Group, forcing a wave of liquidations.
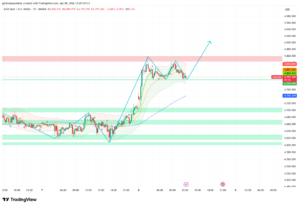
- Immediate Support ($4,825): This is the 20-day Moving Average (MA) and the current line in the sand. As long as prices hold above this, the long-term uptrend remains largely intact.
- Resistance Wall ($4,934 – $4,942): To prove the “crash” is over, bulls must clear this hurdle. This level represents a critical Fibonacci retracement of the recent drop.
- Oversold Momentum: The 14-day RSI is currently hovering around 51.9, which is neutral. This suggests that the initial panic has subsided, but the market lacks the “buying firepower” needed for a full reversal.
Macro Triggers: Why the “Safe Haven” is Shaking
The timing of this Gold Price Crash is no coincidence. The nomination of a hawkish new Fed Chair has signaled a tougher stance on inflation, driving the US dollar to two-week highs and making gold more expensive for global buyers. Furthermore, easing geopolitical tensions regarding Iran have drained the “fear premium” out of the gold market.
For the broader audience, this means the price swings are a reaction to changing policy expectations rather than a failure of gold’s long-term value as a store of wealth.
US Economic Data: The Final Catalyst
The Gold Price Outlook for the remainder of the week hinges on the US Michigan Consumer Sentiment report. A weaker-than-expected reading could signal economic cooling, potentially prompting the Fed to reconsider rate cuts and giving gold bulls the relief rally they need.
Critical Levels to Watch:
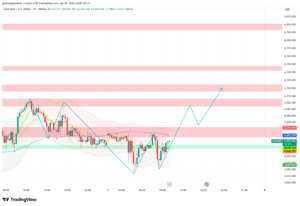
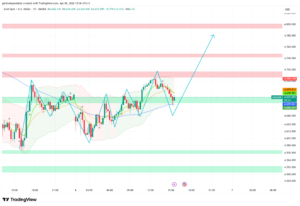
1. **The Bounce Zone ($4,750 – $4,772):** This area, known as Support B, remains the ultimate trend boundary. Bulls successfully defended this zone yesterday.
2. **The Target ($5,090):** If gold can stabilize above $4,825, the next bullish targets are $4,915 followed by $5,090.
Conclusion: Strategic Reaccumulation or Deeper Correction?
Despite the frightening Gold Price Crash headlines, many institutional forecasts remain bullish, with end-of-2026 targets reaching as high as $6,150. This correction is viewed by many as a “healthy reset” of an overheated market. Stay disciplined, respect your stop-losses at $4,670, and watch for a confirmed break above $4,930 to signal safety.

Written by T. S. Gospodinov
T. S. Gospodinov is an Independent gold market analyst focused on liquidity structures and macro-driven price cycles.