
Gold Price Crash: The Day the $5,000 Support Failed
The global financial landscape has shifted violently. On February 6, 2026, a sudden Gold Price Crash sent the yellow metal spiraling toward the $4,750 zone, extending a brutal decline that has seen nearly 4% of its value vanish in a single session. For the general public, this move looks like a collapse of a safe haven, but for institutions, this “liquidity flush” is a tactical reset before the next major economic cycle.
While gold hit record highs above $5,500 just weeks ago, the current price action is driven by a “perfect storm” of a strengthening U.S. dollar and a reduction in the “fear premium” as geopolitical tensions show signs of easing. For many, the question is no longer “how high will it go?” but “where is the bottom?”.
Anatomy of a Sell-Off: Why 4800 Failed
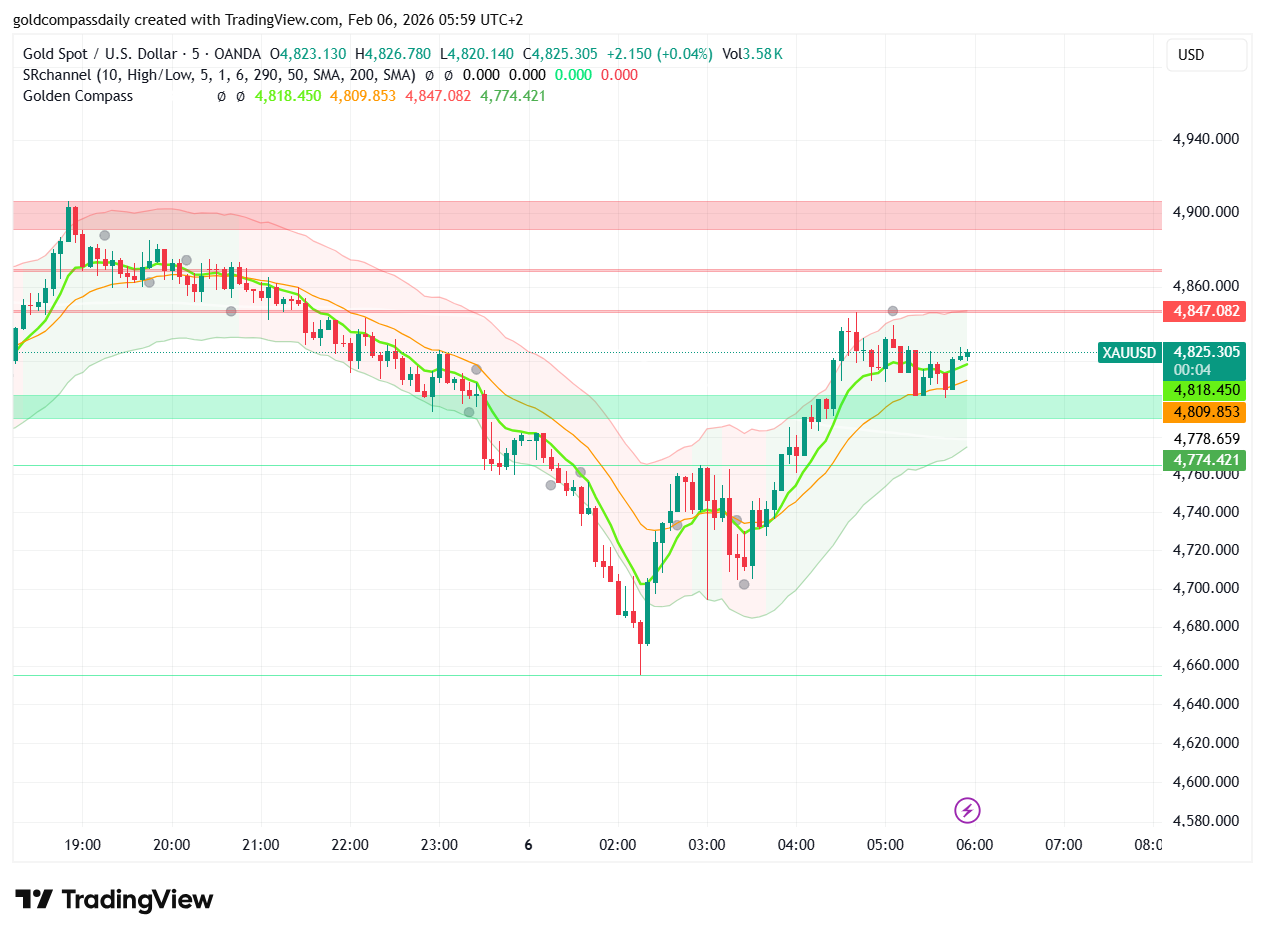
The 5-minute chart provides a microscopic look at the panic. As the Gold Price Crash accelerated, it shattered the psychological floor at $4,800, triggering a cascade of “stop-loss” orders from retail traders.
- The Margin Call Effect: As global equities and crypto markets also saw sharp declines, investors were forced to sell their gold positions to cover losses in other markets, a phenomenon known as “liquidity hunting”.
- The US Dollar Surge: The U.S. Dollar Index recently hit a two-week high, making gold more expensive for holders of other currencies and drying up demand.
- Diplomatic Progress: Reports of US-Iran talks in Oman have significantly cooled the safe-haven demand that previously fueled gold’s parabolic rise.
Technical View: Oversold or Trend Reversal?
Despite the intensity of the Gold Price Crash, technical indicators on the short-term frames are flashing “Extreme Oversold” signals. The RSI (Relative Strength Index) on the 5-minute scale dipped below 20, a level that historically precedes a “snap-back” rally. However, the 1-hour and 4-hour charts remain bearish, suggesting that any immediate bounce may be treated as “exit liquidity” for larger players.
Market participants are now eyeing the $4,650–$4,700 range as the “ultimate floor.” If this zone fails to hold, the short-term technical damage could shift the 2026 outlook from a bull market to a prolonged consolidation phase.
The Central Bank Factor
The Gold Price Crash is also a reaction to a “hawkish” shift in central bank expectations. With the nomination of Kevin Warsh as the next Fed Chair, markets are pricing in a tougher stance on inflation, which typically favors the dollar over non-yielding assets like gold. Until there is clarity on the pace of future interest rate cuts, gold will likely remain under pressure.
Critical Levels to Watch:
1. **The Bounce Zone ($4,824):** Reclaiming this level on high volume is the first step toward a recovery.
2. **The Danger Zone ($4,720):** A break below this level could trigger another wave of institutional liquidations targeting $4,618.
Conclusion: Strategic Patience Over Panic
While today’s Gold Price Crash is painful for those holding long positions, it is essential to remember that gold’s structural drivers—central bank accumulation and public debt concerns—have not vanished. JPMorgan still maintains a long-term target of $6,300 for 2026, suggesting that this “historic crush” might eventually be viewed as a massive buying opportunity for those with the capital to wait.

Written by T. S. Gospodinov
T. S. Gospodinov is an Independent gold market analyst focused on liquidity structures and macro-driven price cycles.


