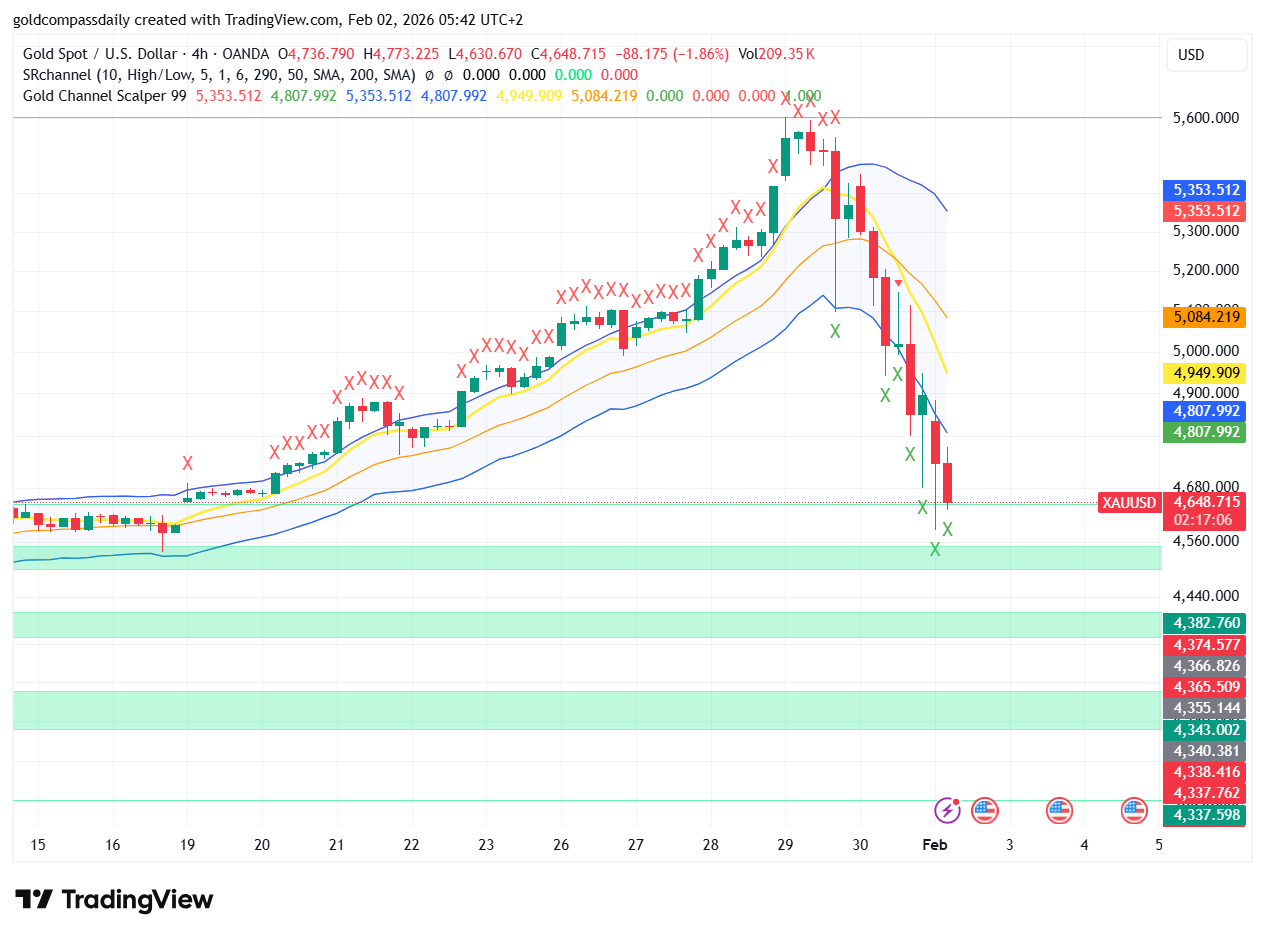
The start of the trading week has brought an unprecedented wave of volatility to the precious metals market. This Gold price crash analysis focuses on the 4-hour (4H) timeframe, where XAU/USD has experienced a dramatic decline. After reaching historic highs near the $5,600 level, a massive wave of liquidation has swept through the market, pushing prices down to the current $4,648 mark. For investors and intraday traders alike, understanding the technical damage caused by this move is vital for navigating the sessions ahead.
The $5,600 Rejection: A Technical Overview
As illustrated in the latest 4H chart, the Gold price crash analysis highlights a decisive rejection at the $5,600 psychological resistance. Following a sustained bullish run marked by multiple “X” buy signals on the Gold Channel Scalper, the momentum shifted abruptly. The price action formed a localized “double top” structure before the selling pressure intensified, leading to a vertical drop that sliced through several major support zones.
The severity of this decline is underscored by the high volume accompanying the red candles. This suggests that institutional profit-taking or large-scale hedging has been triggered. On the 4-hour scale, the price has moved significantly below its 50-period and 200-period moving averages, signaling a shift from a bullish trend to a dominant bearish environment in the medium term.
Deciphering the Gold Channel Scalper Signals
Our Gold price crash analysis wouldn’t be complete without looking at the volatility boundaries. The price has not only broken the midline but has crashed straight through the lower blue boundary of the Gold Channel Scalper 99, which was situated near $4,807. Currently, the price is trading in “oversold” territory, far below the standard deviation bands, which often precedes a period of high-intensity volatility or a corrective bounce.
The indicator is now flashing multiple “X” sell signals (green and red) along the downward path. These signals confirm that the bearish momentum is currently at its peak. The wide gap between the current price and the upper yellow resistance lines ($4,949 and $5,084) shows just how much ground the bulls have lost in a matter of hours. Any recovery attempt will likely face significant headwinds at these newly formed resistance levels.
Critical Support Zones and Liquidity Pools
In this Gold price crash analysis, we identify several key levels that traders need to monitor closely as the London and New York sessions approach:
- Current Support ($4,648.71): This is the immediate floor where the price is currently hovering. A failure to consolidate here could open the door for a move toward the $4,560 area.
- Major Liquidity Zone ($4,382 – $4,337): Our chart identifies a cluster of green support bands much further down. These represent historical areas where buyers have stepped in previously.
- Key Resistance ($4,807.99): The former support has now flipped into a formidable resistance. A daily close back above this level is required to stabilize the market sentiment.
Market Sentiment and Fundamental Drivers
The broader context for this Gold price crash analysis involves a sudden strengthening of the US Dollar Index (DXY) and a shift in global risk appetite. As the new week begins, market participants are reacting to shifts in central bank expectations and geopolitical updates. When gold, typically a safe-haven asset, drops this sharply alongside other assets, it often indicates a “dash for cash” or a broad-market deleveraging event.
Volume data on the 4H chart shows that the selling interest remains high, with over 209K lots traded in the recent periods. This indicates that the move is well-supported by market participation and is not merely a “flash crash” caused by thin liquidity. Until the volume of green candles begins to outweigh the red, the path of least resistance remains to the downside.
Conclusion: Strategic Outlook for XAU/USD
To conclude this Gold price crash analysis, the technical structure for XAU/USD has been severely compromised. The drop from $5,600 to $4,648 is a clear signal that the previous bullish cycle has hit a major roadblock. Traders should exercise extreme caution, as the market is currently in a state of price discovery, looking for a sustainable bottom.
For those utilizing the Golden Compass methodology, the focus should remain on waiting for a consolidation pattern to form on lower timeframes (15M or 5M) before considering any long positions. The primary trend on the 4H chart is now bearish, and “catching a falling knife” can be dangerous in such high-volatility conditions. Protect your capital and stay tuned for our next update as the market reacts to the upcoming economic data releases.

Written by T. S. Gospodinov
T. S. Gospodinov is an Independent gold market analyst focused on liquidity structures and macro-driven price cycles.