Gold Price Drop: Understanding the February Sell-Off
The global precious metals market is currently navigating a period of intense volatility. On February 6, 2026, a significant Gold Price Drop saw the metal fall to approximately $4,750 per ounce, extending a brutal nearly 4% loss from the previous session. For the average investor, this sudden shift away from January’s record highs can be alarming, but understanding the underlying mechanics of this liquidation is key to surviving the turbulence.
This decline is primarily a structural correction following a massive speculative run-up. Investors are currently liquidating gold positions to cover losses in equities and meet margin requirements, a standard phenomenon when rapid price appreciation is followed by high-level policy shifts.
The Triggers: Why Gold is Losing Ground
Several high-impact factors have converged to fuel this Gold Price Drop:
- Stronger U.S. Dollar: The U.S. Dollar Index recently climbed to a two-week high, making gold more expensive for international buyers and dampening its immediate appeal.
- Easing Geopolitical Tensions: Recent high-level communications between major global powers, including US-Iran talks in Oman, have reduced the immediate “fear premium” that supported gold’s surge to $5,000+ last month.
- The “Hawkish” Fed Shift: Following the nomination of Kevin Warsh as Fed Chair, market sentiment has shifted toward a tougher stance on inflation, which typically strengthens the dollar and pressures non-yielding assets like gold.
Technical Analysis: The 4-Hour Perspective
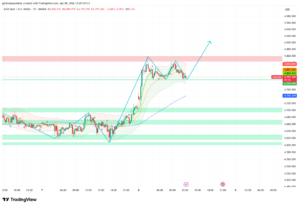
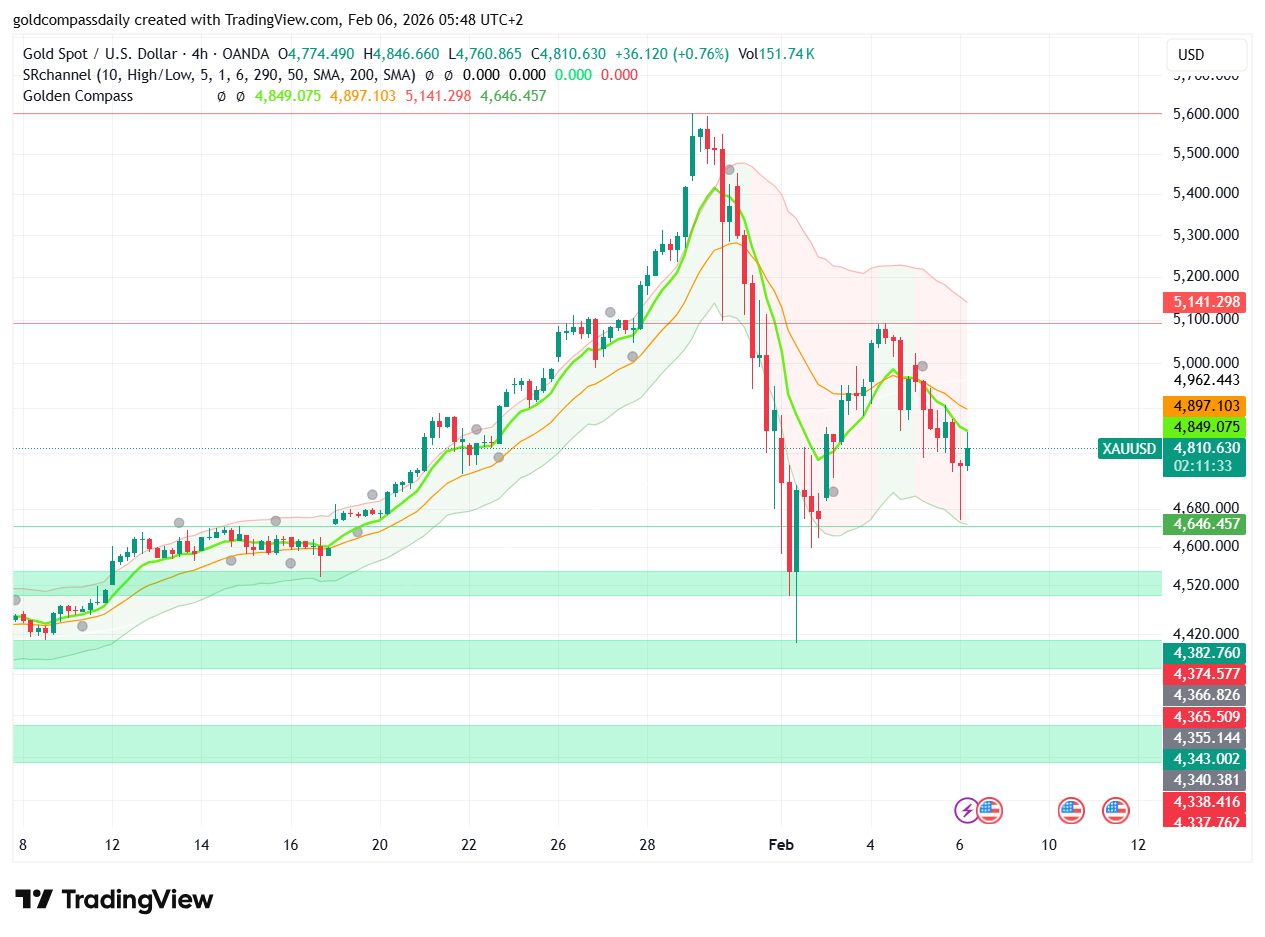
On the 4-hour chart, gold remains under pressure within a corrective phase. While a “Bull Flag” pattern was previously noted, current price action suggests that bearish momentum remains dominant in the short term. The RSI is currently neutral near 45, indicating that while gold is no longer “overbought,” it hasn’t yet reached the “oversold” territory that typically precedes a massive rebound.
For traders, the $4,800 level is now a critical area of “extreme value.” A failure to hold above this zone could trigger a deeper correction, whereas a bounce from these levels could signal that the initial panic is subsidizing.
Is the Bull Run Over or Just Pausing?
Despite the current Gold Price Drop, many long-term analysts remain optimistic. JPMorgan and other major institutions suggest that while silver and gold face deep corrections now, the underlying drivers—such as high public sector debt and central bank demand—remain intact for 2026. Market pullbacks are often viewed by institutional players as shallow buying opportunities before the next leg of a secular bull market.
Key Levels to Watch:
1. **Critical Support ($4,750 – $4,700):** If gold stabilizes here, it could form a base for a recovery toward $5,000.
2. **Resistance ($4,937):** A breakout above this level is required to confirm that the bearish trend has been broken.
Conclusion: Navigating High Volatility
The Gold Price Drop of early February serves as a reminder that even the strongest bull markets require healthy corrections. While the 4-hour chart looks daunting, gold’s role as a ballast against fiat currency debasement remains a primary theme for 2026. Investors should focus on high-value support zones and avoid panic-selling into the heart of a liquidation event.

Written by T. S. Gospodinov
T. S. Gospodinov is an Independent gold market analyst focused on liquidity structures and macro-driven price cycles.