
Gold Price Forecast 2026: The Battle for the $5,000 Threshold
The global precious metals market is entering the week of February 9, 2026, in a state of high-alert. Following a historic “meltdown” where gold plummeted 25% from its peak near $5,600, the metal has staged a remarkable recovery. This Gold Price Forecast 2026 examines whether the current climb back to $5,024 is the start of a new bull run or a sophisticated “bull trap” before another correction.
For the broader audience, gold’s current price is more than just a number on a screen. It reflects the ongoing struggle between massive central bank buying and a “hawkish” shift in US monetary policy following the nomination of Kevin Warsh as the next Fed Chair.
Decoding the 4-Hour Chart: A High-Stakes Recovery
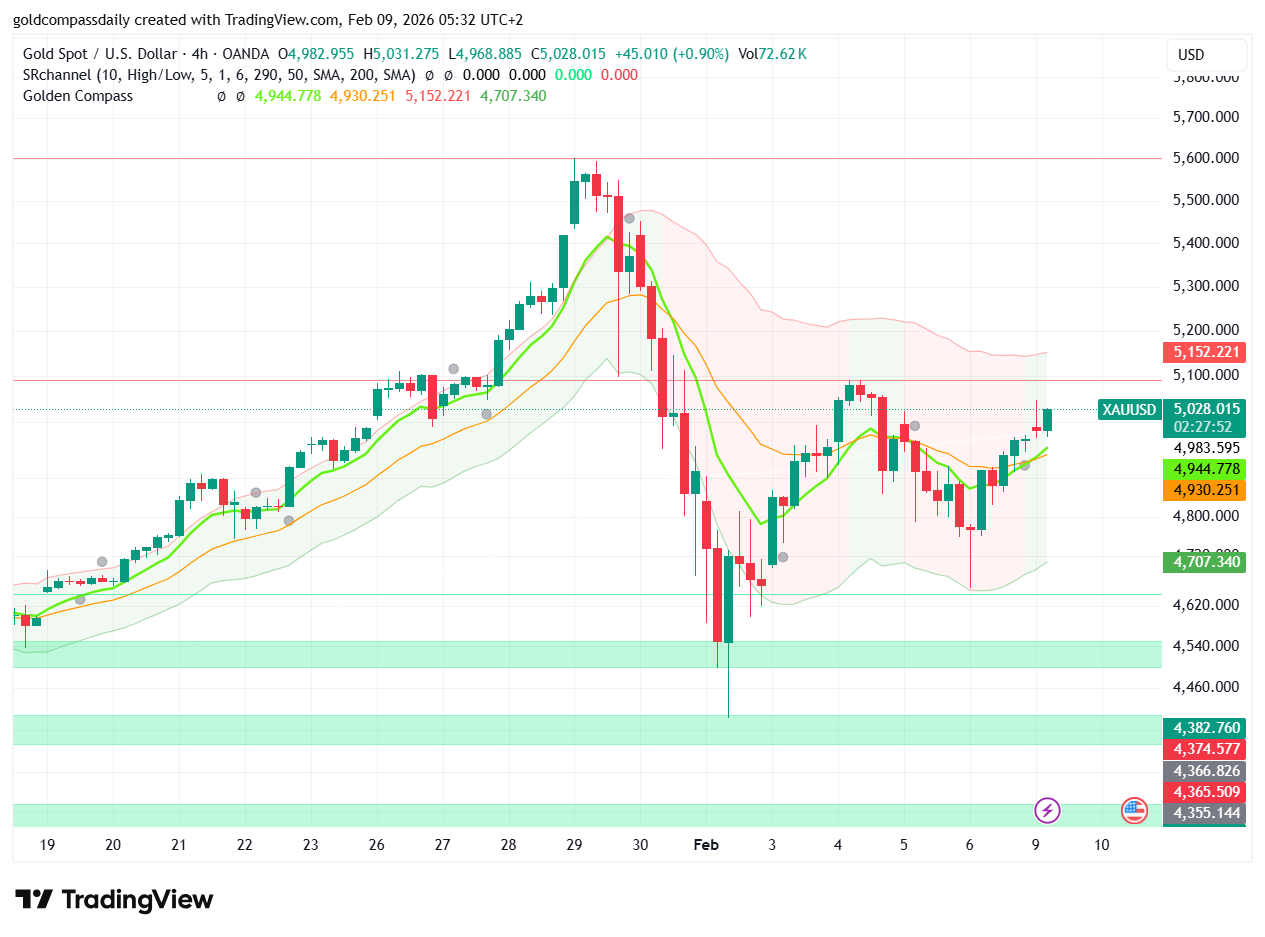
Technical analysis of the 4-hour (H4) timeframe reveals a market transitioning from panic to cautious optimism. After finding a firm “floor” near $4,400, gold has established a series of higher lows, a classic signal that the immediate selling pressure is fading.
- The Support Zone ($4,910 – $4,950): This “flip zone” is the most critical area to watch this week. If gold holds above this level, it confirms that the recent $5,000 breach is sustainable.
- Resistance Barriers ($5,100 – $5,150): This is the “Premium Supply Zone.” Short-term traders should expect significant selling pressure here, as it aligns with the 61.8% Fibonacci retracement of the recent crash.
- Volatility Warnings: Despite the recovery, volatility remains at extreme levels. Margin hikes by the CME Group in early February continue to force highly leveraged traders out of their positions, creating sharp, unpredictable price swings.
Fundamental Catalysts: Inflation and Geopolitics
The Gold Price Forecast 2026 for this week will be heavily dictated by the US Consumer Price Index (CPI) data due on Friday. Higher-than-expected inflation could strengthen the US Dollar, potentially dragging gold back toward the $4,700 support zone.
However, gold remains anchored by powerful “safety” demand. Geopolitical tensions in the Middle East and ongoing trade conflicts, including tariff threats against major partners, continue to drive central banks to diversify away from the dollar. In fact, China’s central bank extended its gold buying streak for a 15th consecutive month this January.
Strategic Outlook: What to Watch This Week
As we move through mid-February, the market’s “directional bias” is leaning bullish, with 67% of analysts predicting a move higher. Long-term targets for late 2026 remain ambitious, with J.P. Morgan forecasting a climb toward $5,400 and beyond.
Levels to Watch:
1. **The Bull Target ($5,153):** Reaching this level would suggest the corrective phase is officially over, opening the way for a retest of $5,300.
2. **The Bear Signal ($4,701):** A daily close below this mark would indicate that the recovery has failed, putting the recent $4,400 lows back on the table.
Conclusion: Strategic Patience Over Panic
The 2026 market is not for the faint of heart. While the recent “crash” was the largest daily percentage fall since the 1980s, the fundamental pillars supporting gold—fiscal uncertainty and central bank demand—remain stronger than ever. This Gold Price Forecast 2026 suggests that while volatility is here to stay, the $5,000 mark is the new battlefield where the trend for the rest of the quarter will be decided.

Written by T. S. Gospodinov
T. S. Gospodinov is an Independent gold market analyst focused on liquidity structures and macro-driven price cycles.


