Current Market Sentiment: Gold at a Crossroads
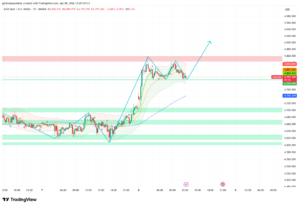
The precious metal has recently experienced a roller-coaster ride, leaving investors and casual observers wondering what comes next. After a significant dip that saw prices touch the $4,520 levels in early February, we have witnessed a classic “V-shaped” recovery. As of February 4, 2026, the Gold Price Forecast suggests we are entering a phase of high volatility as the price approaches a major technical barrier.
For the general public, gold remains the ultimate safe haven. When the dollar fluctuates or geopolitical tensions rise, gold is where the world looks. However, the current 1-hour chart (XAU/USD) reveals a more complex story of supply and demand playing out in real-time.
Technical Analysis: Breaking Down the XAU/USD Chart
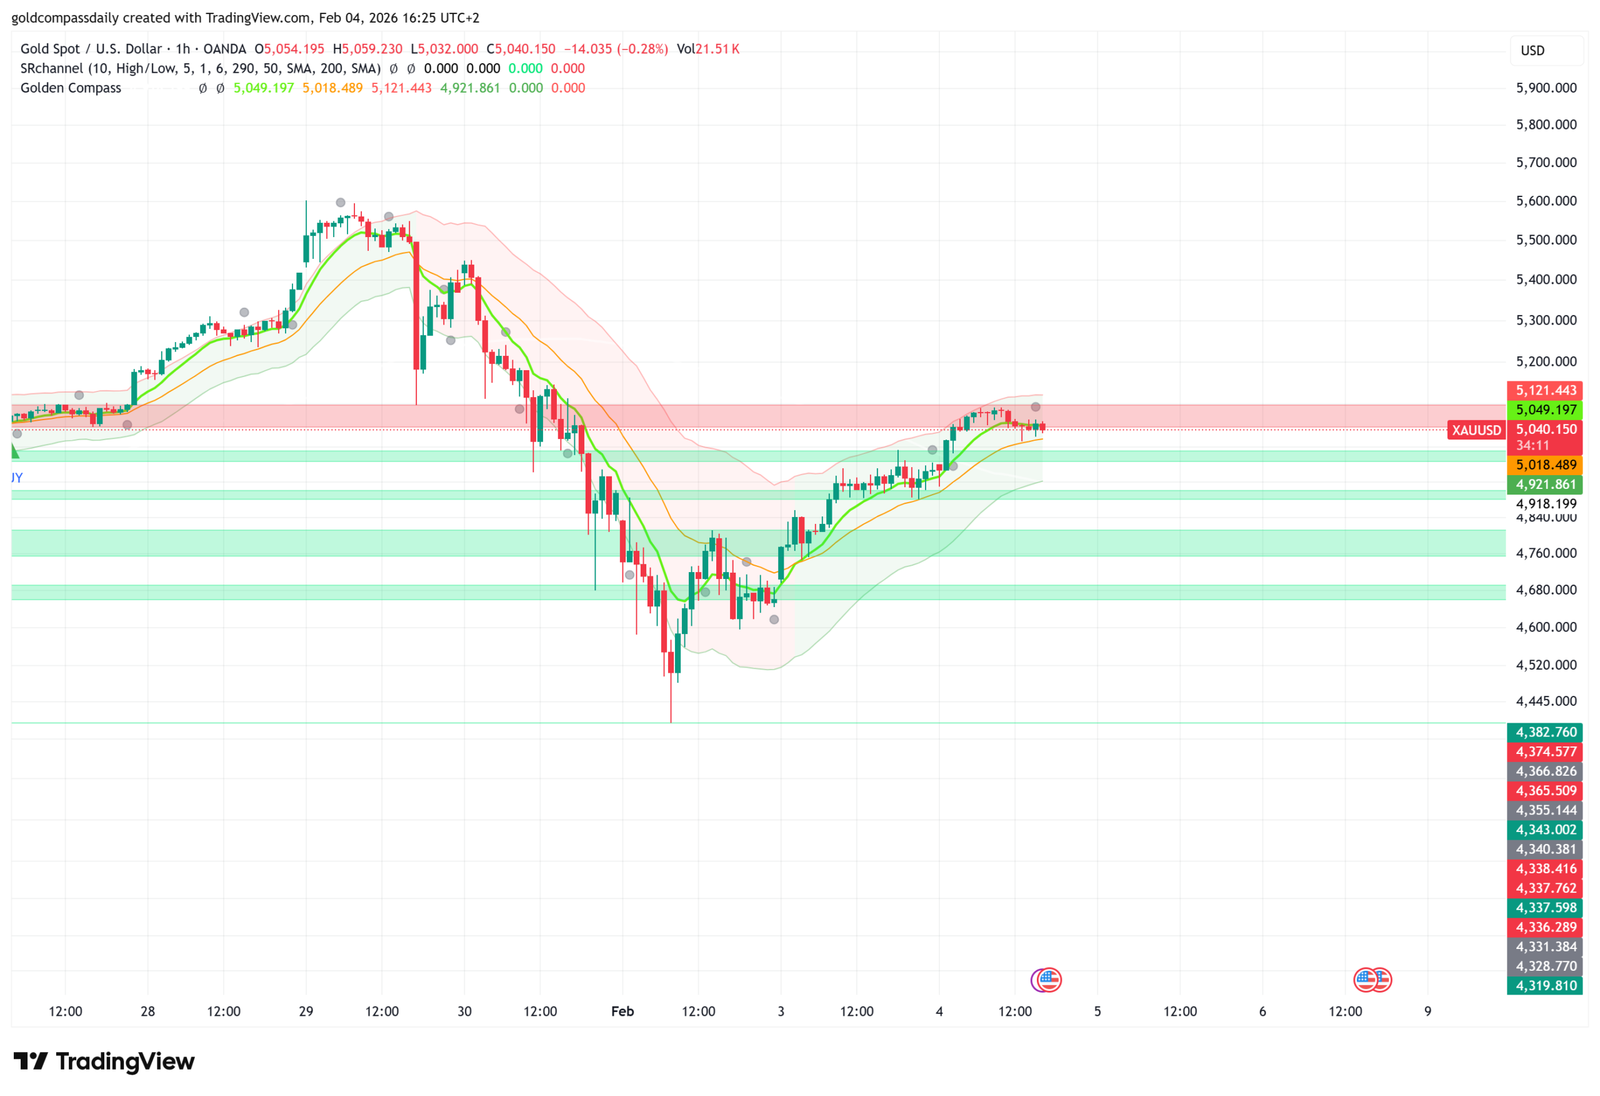
Looking at the hourly timeframe, the recovery from the February lows has been methodical. The “Golden Compass” indicator shows a steady climb back toward the $5,040 – $5,120 zone. This area is highlighted in red on our analysis, marking it as a “Resistance Zone.” In simple terms, this is where sellers typically step in to push the price back down.
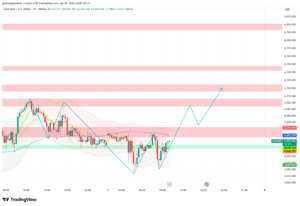
- Support Levels: The immediate floor is found at $4,921. If the price stays above this, the bullish momentum remains intact.
- Resistance Levels: The $5,049 mark is the current hurdle. A clean break above $5,121 could trigger a massive wave of buying.
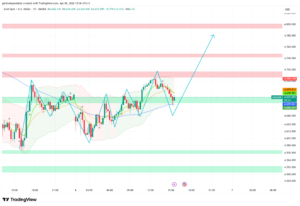
- Moving Averages: The price is currently dancing around the 50 and 200 SMA (Simple Moving Averages), indicating a battle for direction between long-term investors and short-term speculators.
Why This Gold Price Forecast Matters for You
You don’t need to be a professional trader to understand why this movement is critical. Gold prices often lead the way for other financial markets. A strong gold price usually signals a “risk-off” environment where investors are cautious about the economy. Conversely, if gold fails to break the $5,050 resistance, it might suggest growing confidence in other assets like stocks or digital currencies.
The “SR Channel” (Support/Resistance Channel) visible on the chart shows a narrowing range. This “squeezing” of price action often precedes a violent breakout in either direction. For those holding physical gold or gold-backed ETFs, this is the time to watch the $5,000 psychological level very closely.
What to Watch in the Coming Days
As we move further into the week, several economic indicators could act as catalysts. The flags at the bottom of the chart indicate upcoming US economic data releases, which historically cause “spikes” in gold volatility. If the US dollar weakens, our Gold Price Forecast leans toward a breakthrough of the red resistance zone, potentially targeting the $5,300 highs seen in late January.
Strategic Conclusion for Investors
The current setup is a textbook example of a market seeking equilibrium. For traders, the strategy involves looking for “confirmation”—either a rejection at the red zone for a short play or a candle closing above $5,121 for a long play. For the general audience, the message is simple: Gold is testing its strength. If it holds these gains, the road to new all-time highs is wide open.

Written by T. S. Gospodinov
T. S. Gospodinov is an Independent gold market analyst focused on liquidity structures and macro-driven price cycles.