The Gold Price Outlook: Navigating Unexpected Volatility
Gold (XAU/USD) has long been the “North Star” for investors seeking safety. However, the latest 4-hour chart reveals a dramatic shift in market dynamics. After a promising recovery attempt, the precious metal has faced a sharp rejection, leaving many asking if the bull run is over or if this is merely a temporary setback in a larger uptrend.
Understanding the Gold Price Outlook is no longer just for professional Wall Street traders. In an era of inflation and shifting interest rates, the price of gold affects everything from jewelry prices to the health of your retirement savings. Today, we break down the technical signals to see where the market is headed next.
Technical Breakdown: The Battle at the Resistance Zone
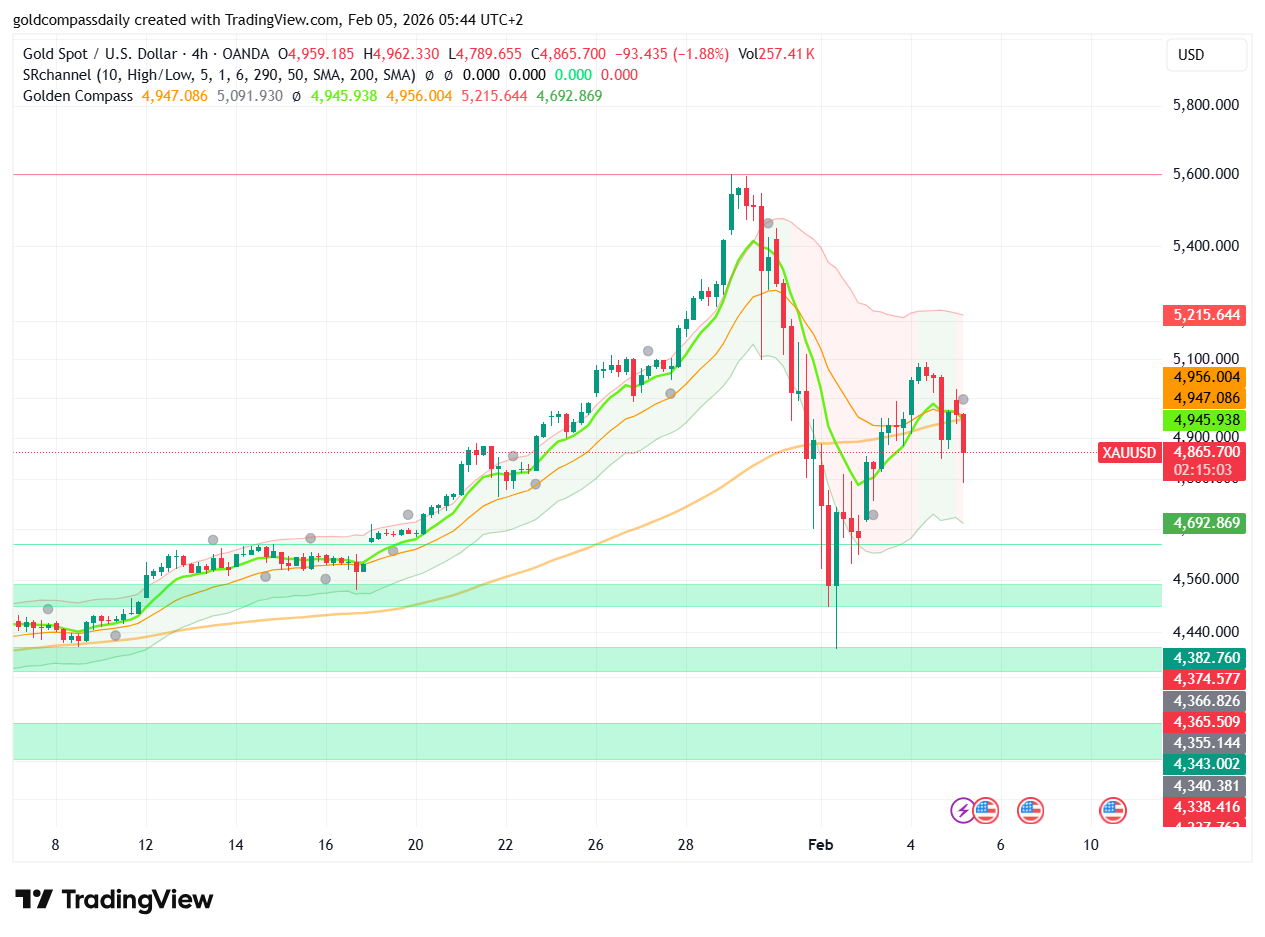
Looking at the 4-hour timeframe, the most striking feature is the “rejection candle” near the $5,000 level. This psychological barrier proved too tough for buyers to crack on the first attempt. Our technical indicators, including the SR Channel and the Golden Compass, provide clear landmarks for what to expect.
- The Resistance Wall: The red zone between $4,956 and $5,215 acts as a heavy ceiling. Gold struggled to maintain its footing here, leading to the current dip.
- Critical Support Found: Currently, the price is hovering around the $4,865 mark. Below this, the next major “safety net” sits at the green zone around $4,692.
- Trend Indicators: The 50 and 200-period moving averages are starting to converge. This often signals a “squeeze,” meaning a very large move is brewing.
Why the General Public Should Pay Attention
For the average person, a falling gold price might seem like bad news, but in the world of investing, it is often viewed as a “discount.” The Gold Price Outlook remains tied to the strength of the US Dollar. As economic data from the US continues to surprise the markets, gold reacts like a coiled spring.
If you are looking at gold as a long-term hedge, these price fluctuations are part of the journey. The current chart shows that while the short-term momentum is bearish (downward), the long-term structural support levels have not yet been broken. This suggests that the “big picture” for gold might still be positive despite the recent local crash.
Key Triggers to Watch This Week
Volatility is the name of the game. On our 4-hour chart, several economic “impact flags” are visible. These represent upcoming Federal Reserve announcements and employment data. Historically, these events cause gold to move $50-$100 in a matter of minutes.
Strategic Forecast: Bounce or Break?
The immediate Gold Price Outlook depends on the $4,840 level. If gold can stabilize here, we may see a “double bottom” formation, which is a classic signal for a massive rally back toward $5,200. However, a failure to hold this support could see prices slide further toward the $4,500 range, which acted as a strong floor earlier in February.
Conclusion: Is Now the Time to Buy?
Successful investing is about timing and patience. Right now, gold is in a “wait and see” zone. For traders, the play is to wait for a confirmed bounce off the green support zones. For the general audience, it’s a reminder that even the most stable assets don’t move in a straight line. Keep a close eye on the $4,900 pivot point—it will be the decider for the rest of the month.

Written by T. S. Gospodinov
T. S. Gospodinov is an Independent gold market analyst focused on liquidity structures and macro-driven price cycles.