
Gold Price Today: Navigating the 5-Minute Market Chaos
If you looked at the Gold Price Today and felt a knot in your stomach, you are not alone. In a matter of hours, gold (XAU/USD) experienced a vertical drop that wiped out days of steady gains. For the general public, this might look like a disaster, but for those who understand market mechanics, it is a moment of intense clarity and opportunity.
Gold has always been the ultimate barometer of global fear. When prices move this fast on a 5-minute scale, it tells us that a major economic catalyst has hit the wires, forcing institutional investors to liquidate positions. Whether you are a retail trader or someone protecting their savings, understanding this volatility is key to surviving the current financial climate.
Technical Deep Dive: The Anatomy of a Breakdown
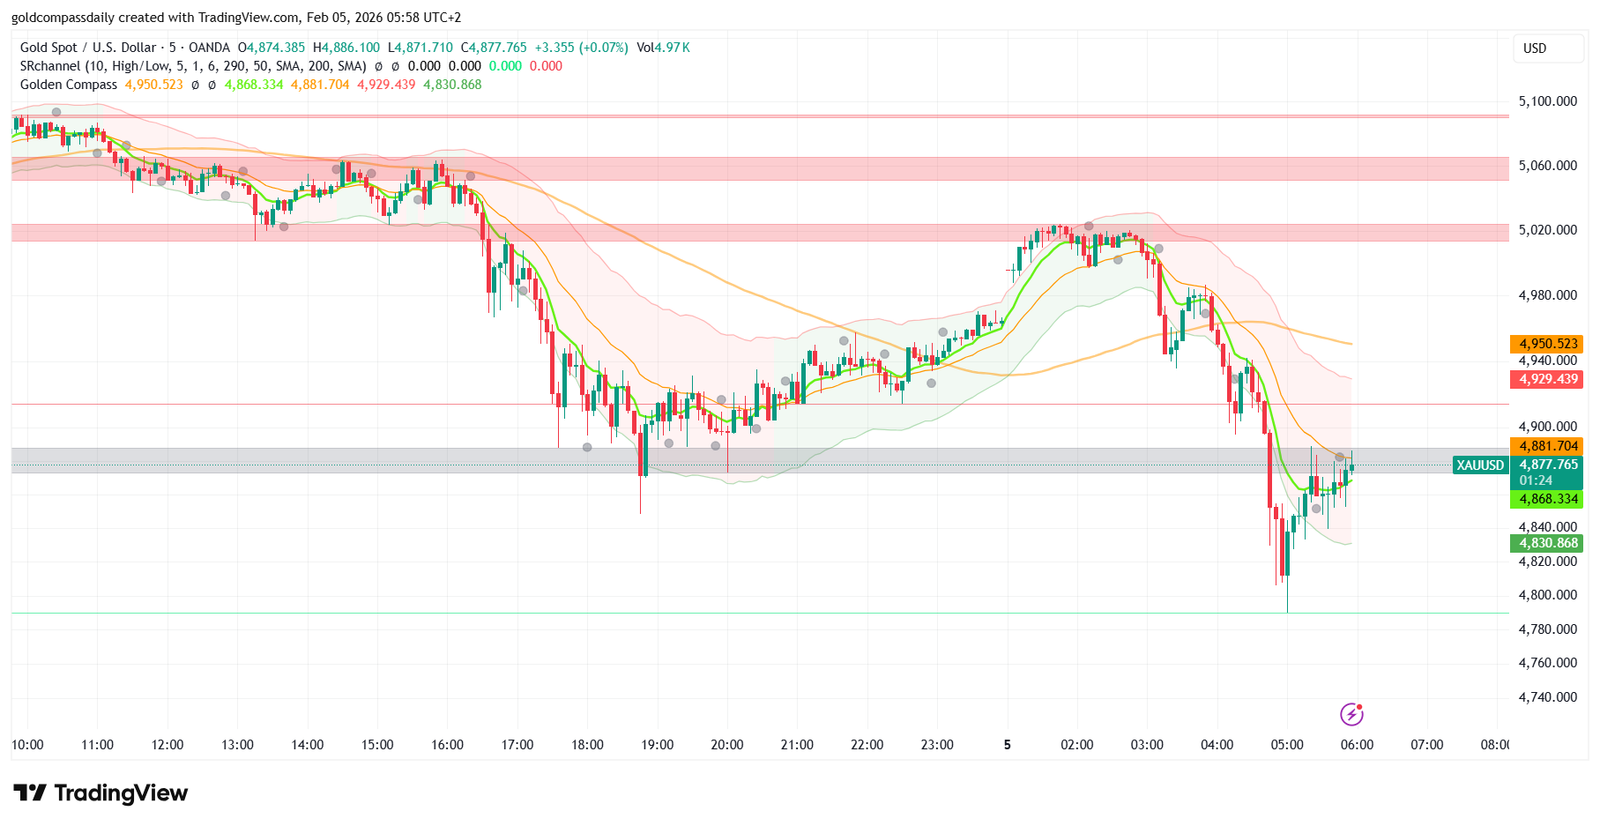
Analyzing the 5-minute (M5) chart reveals a textbook “liquidation hunt.” After consolidating near the $4,980 levels, the price hit a wall of selling pressure that sent it spiraling toward the $4,840 zone. Let’s look at the key technical markers provided by our Golden Compass and SR Channel indicators:
- The Vertical Drop: The move from $5,020 down to $4,830 happened with almost no resistance, indicating a lack of buyers in that specific range.
- Immediate Support: We are currently seeing a “cluster” of activity around $4,868. This is the first sign of life from the bulls (buyers) after the crash.
- The Oversold Bounce: On the M5 timeframe, gold is technically “screaming” for a correction. When a price falls this fast, it often needs to “breathe” by bouncing back to test previous broken floors.
Why This Volatility Affects Everyone
You might ask: “Why should I care about a 5-minute chart?” The answer is simple. Short-term price action often dictates the long-term trend. The Gold Price Today serves as a warning. If gold cannot recover quickly from this $4,830 support level, it could signal a broader shift in the global economy—perhaps a pivot in central bank policies or a sudden surge in US Dollar strength.
For the average observer, this is a reminder that even the safest assets are subject to the laws of supply and demand. This isn’t just about numbers; it’s about the collective psychology of millions of investors reacting to news in real-time.
Is This a Buying Opportunity or a Value Trap?
The biggest question regarding the Gold Price Today is whether this is the “bottom.” Our technical setup shows that the price is currently trapped between a rock ($4,830 support) and a hard place ($4,929 resistance).
Levels to Watch for the Next Move:
If the price manages to climb back and close a 5-minute candle above $4,881, we could see a rapid recovery toward the $4,950 zone. However, if the $4,830 floor cracks, the next stop is the psychological $4,800 mark, which hasn’t been tested in weeks. For traders, the “Golden Compass” suggests waiting for the orange and green lines to stabilize before entering any new positions.
Strategic Summary
In conclusion, the Gold Price Today is in a state of high-alert. We have moved from a steady uptrend into a “discovery phase” where the market is trying to find its new fair value. While the 5-minute chart looks scary, it provides the most precise entries for those with a disciplined strategy. Stay patient, watch the support zones, and don’t let the “noise” of the crash cloud your long-term vision.

Written by T. S. Gospodinov
T. S. Gospodinov is an Independent gold market analyst focused on liquidity structures and macro-driven price cycles.


