
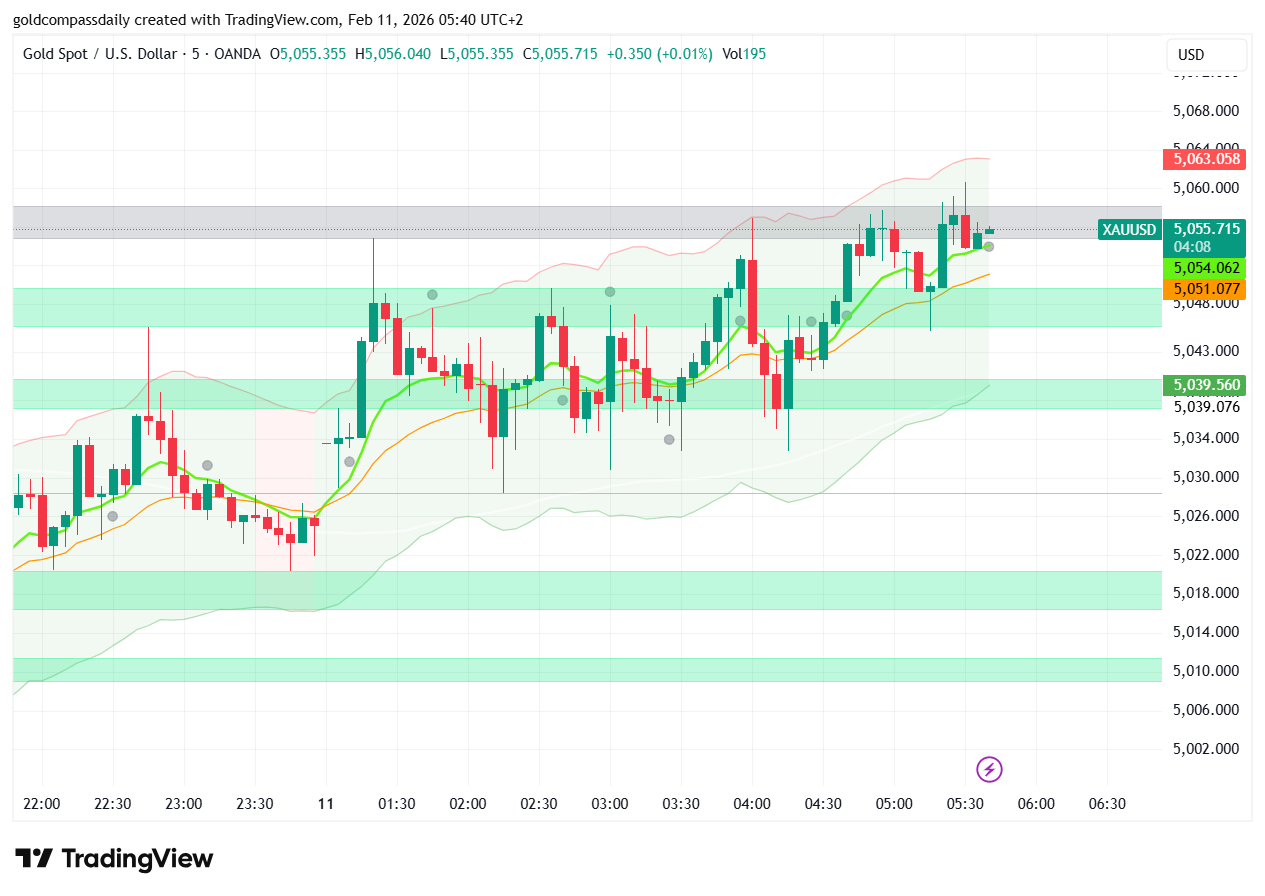
As of February 11, 2026, gold prices are exhibiting a mild rebound in early Asian trading, with XAU/USD trading around $5055.715 per ounce, up 0.01% from session lows. This follows a brief dip to $5043 amid consolidation. Current spot prices range from $5045.165 low to $5055.735 high, according to real-time data from TradingView and Investing.com, with volume at 195 indicating quiet market participation. For everyday investors exploring gold as an inflation hedge, and for active traders seeking intraday signals, this gold price today analysis dissects the 5-minute chart action, fundamental catalysts, and possible scenarios. With central bank demand and U.S. data on the horizon, could this rebound ignite a fresh surge?
Current Gold Price Today Overview
Gold has begun the session with subdued volatility, holding above key supports after yesterday’s stabilization. By 06:40 UTC+2, XAU/USD has recovered to $5055.715, closing the latest 5-minute candle with a slight +0.350 gain. This represents a net flat performance overall, but the intraday range highlights resilience, with prices up approximately 0.2% from recent dips. Over the past week, gold has gained about 1.5%, and year-over-year it’s up over 70%, fueled by persistent safe-haven buying, as reported by Kitco and Trading Economics.
For non-traders, gold’s movements often signal broader economic health – climbing when uncertainty rises. Today, amid global tensions, tracking gold price today can guide simple decisions like adding to a savings portfolio via apps or physical assets, without complex strategies.
Technical Breakdown: The 5-Minute Chart Insights
The 5-minute TradingView chart for XAU/USD shows a consolidation pattern with bullish hints. Covering February 10–11, prices fluctuated between $5043–$5055, starting with a downward red candle series testing lower levels around 23:30 on Feb 10. The latest bars exhibit green momentum: a rebound from $5043 low, pushing through the 50-period SMA at ~$5051 and closing at $5055.715 with steadying volume (195).
Key technical levels on the 5-minute timeframe include:
- Resistance ($5055–$5064): This immediate ceiling has limited upside; a break above $5055 could target $5073–$5094, aligning with the Golden Compass upper band.
- Support ($5043–$5016): The session low at $5043 acts as pivot. Holding here averts a slide to $5000, while a bounce strengthens short-term bullish bias.
- Moving Averages & Indicators: The 50-period SMA at ~$5051 provides dynamic support, with shorter MAs flattening upward. Momentum indicators show neutral conditions, suggesting potential for upside if volume increases.
The chart’s “ascending channel” formation indicates accumulation – a setup where minor dips attract buyers in bull markets. For beginners, this means gold is pausing for breath, potentially readying for higher moves if catalysts emerge.
Fundamental Drivers Shaping Gold Prices
Fundamentally, today’s rebound is aided by a pause in dollar strength and easing yields, counterbalancing hawkish Fed signals. Kevin Warsh’s Fed Chair nomination adds uncertainty, but markets eye tomorrow’s CPI for clues – softer data could weaken the USD, boosting gold. China’s ongoing gold-buying streak (15 months) offers a floor, amid devaluation fears, as per Reuters and World Gold Council updates.
Geopolitical anchors (Middle East, tariffs) and fiscal concerns further support. Analysts from JPMorgan forecast $6000+ by year-end, citing de-dollarization. For average readers, this emphasizes gold’s protective role – a shield against volatility, suitable for emergency funds or retirement plans.
Trading Strategy: What to Watch Next
For scalpers on the 5-minute chart, range plays prevail: buy near $5043 support with stops below $5016, targeting $5055–$5064 for quick pips. Swing traders should monitor a close above $5055 for longs toward $5073, using 1% risk in this low-volume setup (195 suggesting thin liquidity).
Non-traders can dollar-cost average on dips below $5050, capitalizing on the bull trend. Market psychology favors optimism after leverage flushes – this rebound clears weak hands, positioning for potential highs in upcoming cycles.
Conclusion: Rebound Signals Strength
This gold price today analysis points to a market building momentum, with the 5-minute chart hinting at upside continuation if resistance yields. While short-term data risks linger, fundamentals like demand keep the 2026 view bullish. Track $5000–$5100 levels, and stay adaptive in volatile times.
Gold’s enduring value shines through – whether for trading or security, today’s insights inform smarter choices.

Written by T. S. Gospodinov
T. S. Gospodinov is an Independent gold market analyst focused on liquidity structures and macro-driven price cycles.


