The week concludes with a dramatic reversal for gold investors. After an euphoric surge toward the psychological barrier of $5,600, the market has entered a period of harsh correction. This Gold Price Weekly Outlook analyzes whether this is a healthy profit-taking phase or the beginning of a deeper bearish trend.
Technical Analysis: Breakdown Below Critical Levels
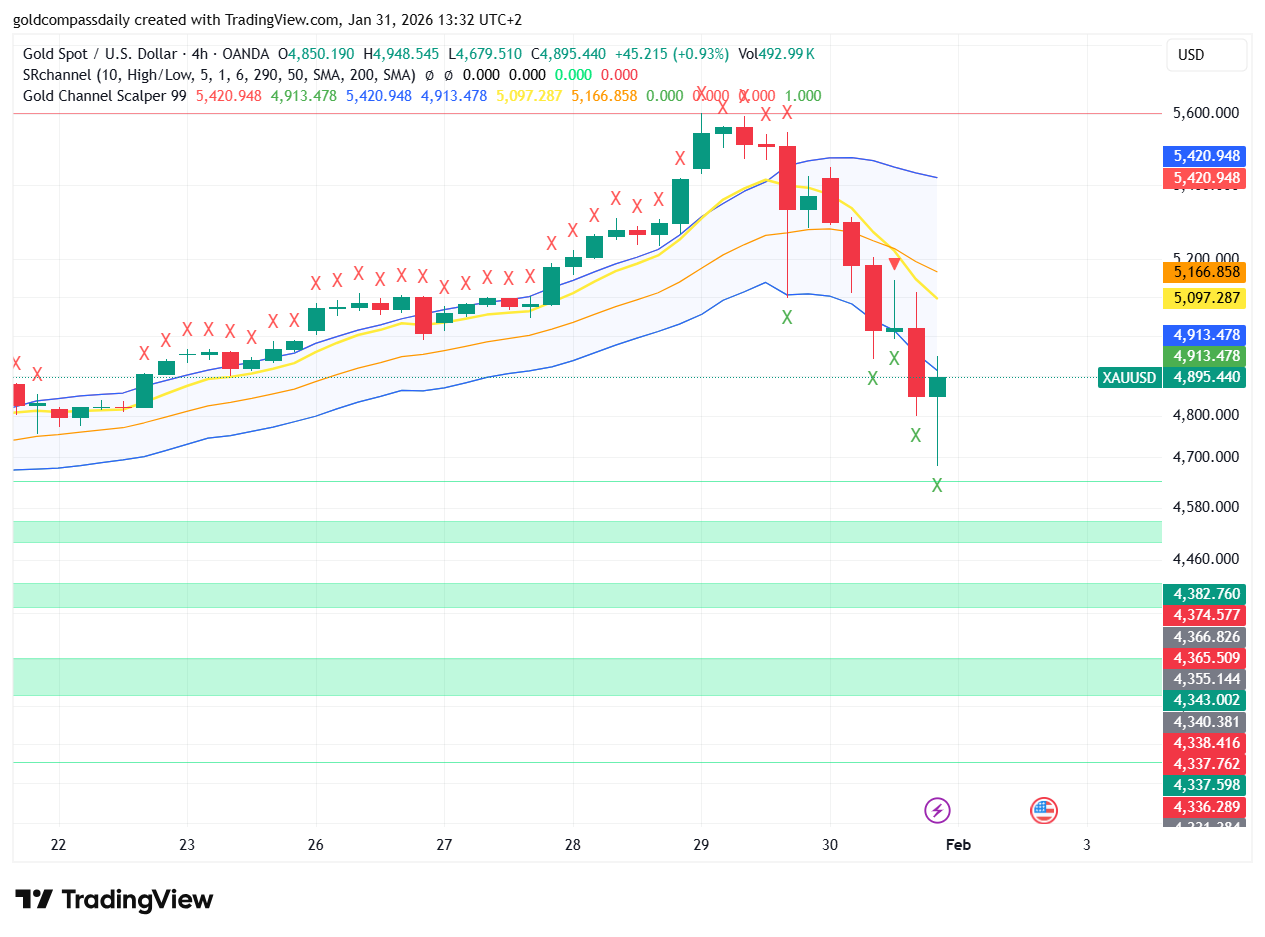
According to the 4-hour chart (4H), gold underwent an aggressive sell-off that breached the dynamic support of the Gold Channel Scalper 99. The price fell from its peaks at an alarming speed, currently stabilizing around the $4,895 level. This decline has erased much of the weekly gains, putting the strength of the bulls into question.
Our indicator shows that the price has exited the upper boundary of the channel and tested the median moving average (the yellow line), which is currently acting as resistance. The lack of an immediate recovery above $5,100 suggests that bears still maintain control over short-term price action.
Key Support and Resistance Zones
In this Gold Price Weekly Outlook, it is crucial to define where the “whales” might re-enter the market:
- Support 1 ($4,895): The current level is decisive. If we close the week below it, the next stop is the $4,700 zone.
- Buyer’s Zone ($4,580 – $4,600): This is the broad green zone on the chart where we expect strong demand to manifest.
- Major Resistance ($5,166): As long as the price remains below this threshold, any bounce will be considered a “dead cat bounce” or a trap for buyers.
Fundamental Backdrop: The Dollar and Interest Rates
The sell-off did not happen in a vacuum. Investors are reassessing risk following recent inflation data and signals regarding the Fed’s monetary policy. Although gold remains a primary safe-haven asset, the market was severely “overheated,” and a technical correction was inevitable after the parabolic movement seen earlier this week.
What to Expect Next Week?
We are entering the beginning of February with increased volatility. The strategy for the coming days should be cautious. Traders using our scalping indicator should look for confirmed “Long” signals only if the price manages to break back above $5,100 with significant volume.
If the support at $4,800 fails to hold, we could witness cascading sell-offs toward the $4,300 – $4,400 levels, where long-term liquidity pockets are located. This Gold Price Weekly Outlook advises strict risk management and the use of stop-loss orders in this unpredictable environment.
In conclusion, while gold remains in a long-term uptrend, the current correction is a vital test of the market structure. The next few trading sessions will determine whether we see a new attempt to attack $6,000 or enter a more prolonged phase of consolidation.

Written by T. S. Gospodinov
T. S. Gospodinov is an Independent gold market analyst focused on liquidity structures and macro-driven price cycles.