
Gold Tests Fibonacci Zone Before Next Push — $5,187 in Sight
Gold is trading at a critical juncture this Monday morning. After a strong overnight rally that pushed XAU/USD from below $5,120 all the way to $5,187.241, price is now pulling back into the Fibonacci retracement zone — and the chart suggests that pullback is part of the move, not the end of it.
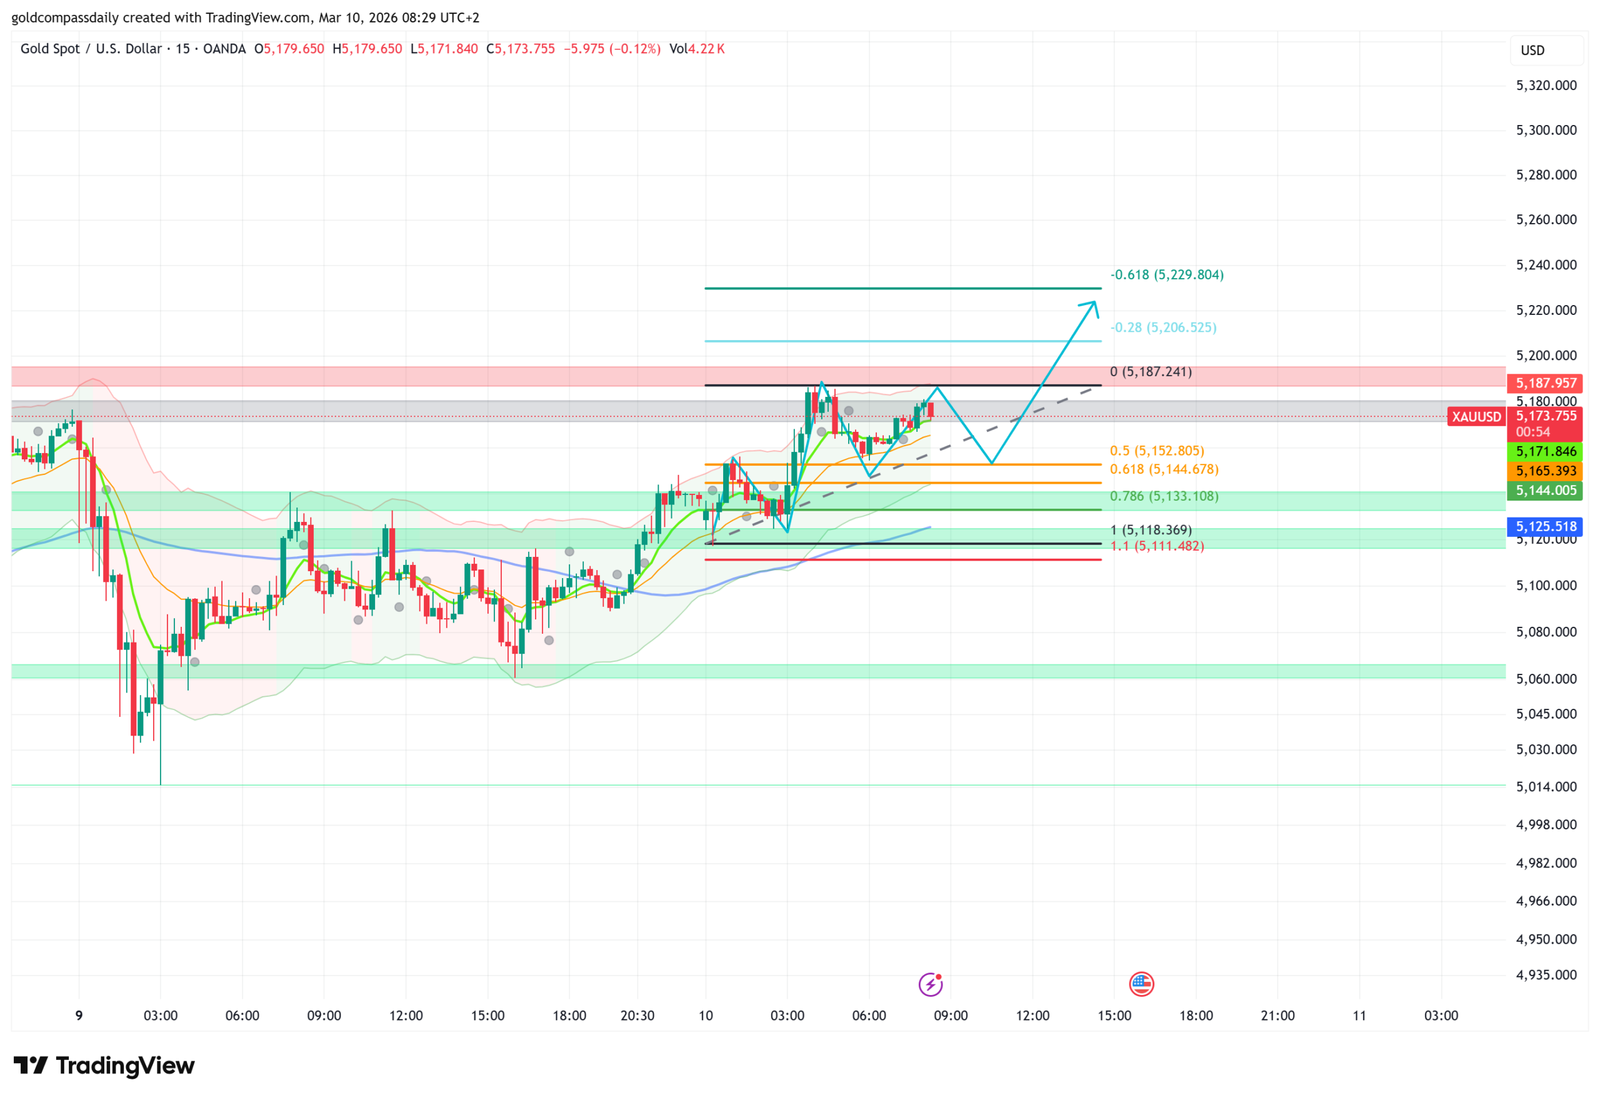
XAU/USD is currently around $5,173, holding above the green demand zone that has been a reliable floor over the past 48 hours. The 15-minute structure is constructive: higher lows, a clear upward-sloping trendline, and a Fibonacci grid that maps out exactly where buyers need to step in.
The Fibonacci Structure
The grid on this chart runs from the swing low at $5,111.482 (1.1 extension) up to the recent high at $5,187.241 (0 level). That gives a $75 range with clean retracement levels to work with. Price has already tested the upper Fibonacci levels and is now pulling back into the 0.786–0.618 zone between $5,133.108 and $5,144.678.
That cluster is the key area to watch. The 0.786 at $5,133.108 represents a deep but still-valid retracement within an uptrend. The 0.618 at $5,144.678 is the more conservative entry. Together they form a demand zone that, if it holds, keeps the bullish structure entirely intact.
Above price, the 0.5 retracement at $5,152.805 is the first recovery confirmation level — a hold in the $5,133–$5,144 zone followed by a push back through $5,152 signals buyers are back in control.
The Setup: Test the Zone, Then Break $5,187
The projected path on the chart is a pullback into the $5,133–$5,144 Fibonacci cluster, a hold, and then a continuation toward $5,187.241 — the swing high and the Fib 0. A clean break above that level, which also coincides with the top of the grey horizontal resistance band, opens the door to the extension targets: $5,206.525 (-0.28) and $5,229.804 (-0.618).
The dashed trendline running beneath price reinforces this structure. It has connected the lows of the overnight rally and is currently acting as dynamic support. A bounce from the Fibonacci zone that also respects the trendline would be the ideal confirmation for a continuation trade.
Bullish Scenario
Price pulls back into the $5,133.108–$5,144.678 zone (Fib 0.786–0.618), holds, and recovers above $5,152.805 (Fib 0.5). That sequence confirms the pullback is over and sets up a push toward the primary target at $5,187.241 (Fib 0). A break above $5,187 with follow-through opens $5,206.525 and $5,229.804.
Bearish Scenario / Invalidation
A close below $5,133.108 (Fib 0.786) invalidates the setup. That is the entry zone itself — if price breaks through it rather than holding, buyers are not showing up where they need to. The trendline would also be broken at that point, and the projected move toward $5,187 is off the table.
Key Levels at a Glance
- Resistance: $5,187.241 (Fib 0) → $5,206.525 (-0.28) → $5,229.804 (-0.618)
- Support / Entry Zone: $5,144.678 (Fib 0.618) → $5,133.108 (Fib 0.786)
- Confirmation Level: $5,152.805 (Fib 0.5) — recovery above here signals bounce is underway
- Primary Target: $5,187.241 — breakout above the consolidation high
- Invalidation: Close below $5,133.108 (Fib 0.786) — entry zone fails
- Bias: Bullish from $5,133 — invalidated on a close below that level
The setup is defined. Gold needs to hold $5,133.108 and push back through $5,152. If that plays out, $5,187 is the first target — and a break above it puts the extension levels in play for the first time this week. A close below $5,133 and the setup is done.
Analysis based on the XAU/USD 15-minute chart as of March 10, 2026, 08:29 UTC+2. This is technical analysis for educational purposes only and does not constitute financial advice.

Written by T. S. Gospodinov
T. S. Gospodinov is an Independent gold market analyst focused on liquidity structures and macro-driven price cycles.


