
As of February 19, 2026, Gold (XAU/USD) is executing the technical correction exactly as projected in our previous sessions. After a period of bullish exhaustion near the $5,100 resistance, the metal has entered a measured pullback, with price action now gravitating toward key Fibonacci support zones to stabilize the mid-term trend.
Fibonacci Confrontation: The 0.5 Retracement Pivot
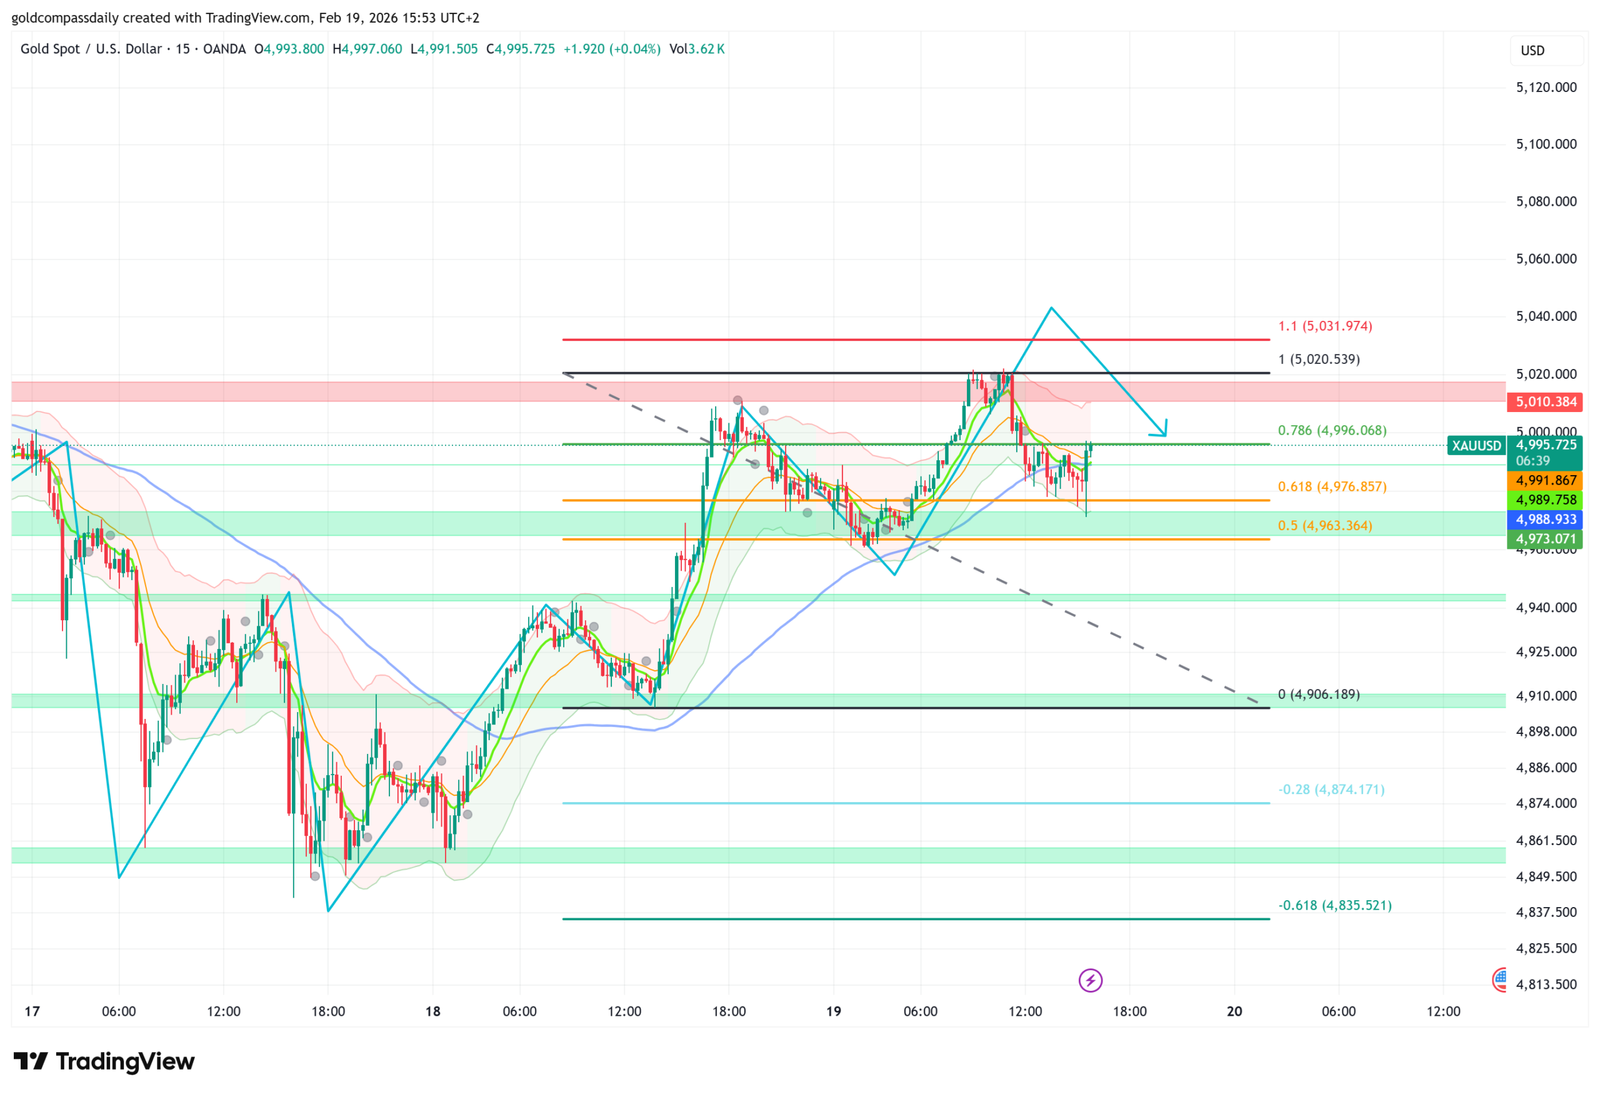
The current price action is hovering near the 0.5 Fibonacci retracement level ($4,990) of the recent leg from $4,402 to $5,598. This level is acting as a magnetic equilibrium point where buyers and sellers are re-evaluating the next directional impulse. A sustained close below this handle would confirm that the corrective phase is intensifying, shifting the focus to deeper liquidity pockets.
- Structural Resistance: The $5,026 zone (21 SMA) remains a formidable barrier that must be reclaimed to invalidate the current bearish correction.
- Immediate Fibonacci Support: The 0.5 level at $4,990 is the primary floor for today’s session.
Downward Trajectory: Targeting the 0.618 Golden Ratio
If the correction continues along the forecasted path, the ultimate technical objective for bulls remains the 0.618 Fibonacci level near $4,821 – $4,827. This zone aligns perfectly with the 200-period EMA on the shorter timeframes, making it a “high-conviction” area for a potential bullish reversal.
- Secondary Target: Should momentum accelerate, the $4,760 daily low represents a final structural barrier before a deeper trend re-evaluation.
- Upside Trigger: A breakout above the $5,046 swing high is required to resume the path toward $5,120 and beyond.
Technical Matrix & Fibonacci Milestones
| Strategic Milestone | Price Level | Current Status |
|---|---|---|
| Upper Supply Zone | $5,141 | 0.618 Fibo Resistance |
| Intraday Pivot | $4,990 – $4,996 | Active 0.5 Fibo Support |
| Deep Correction Target | $4,821 – $4,827 | 200 EMA & Major Fibonacci |
| Trend Floor | $4,760 | Liquidity Base |
Disclaimer: This analysis is based on current technical patterns and Fibonacci retracement data as of February 19, 2026. Trading XAU/USD involves significant risk. Always use stop-loss orders to manage capital during volatile corrective phases.

Written by T. S. Gospodinov
T. S. Gospodinov is an Independent gold market analyst focused on liquidity structures and macro-driven price cycles.


