
As of February 20, 2026, Gold (XAU/USD) is demonstrating remarkable technical precision by utilizing the 0.5 Fibonacci retracement level as a foundational support zone. Following the volatile swings seen earlier this month, this “halfway back” mark has emerged as the primary psychological and structural floor where buyers are actively re-entering the market.
0.5 Fibonacci Support: The Pivot to Stability
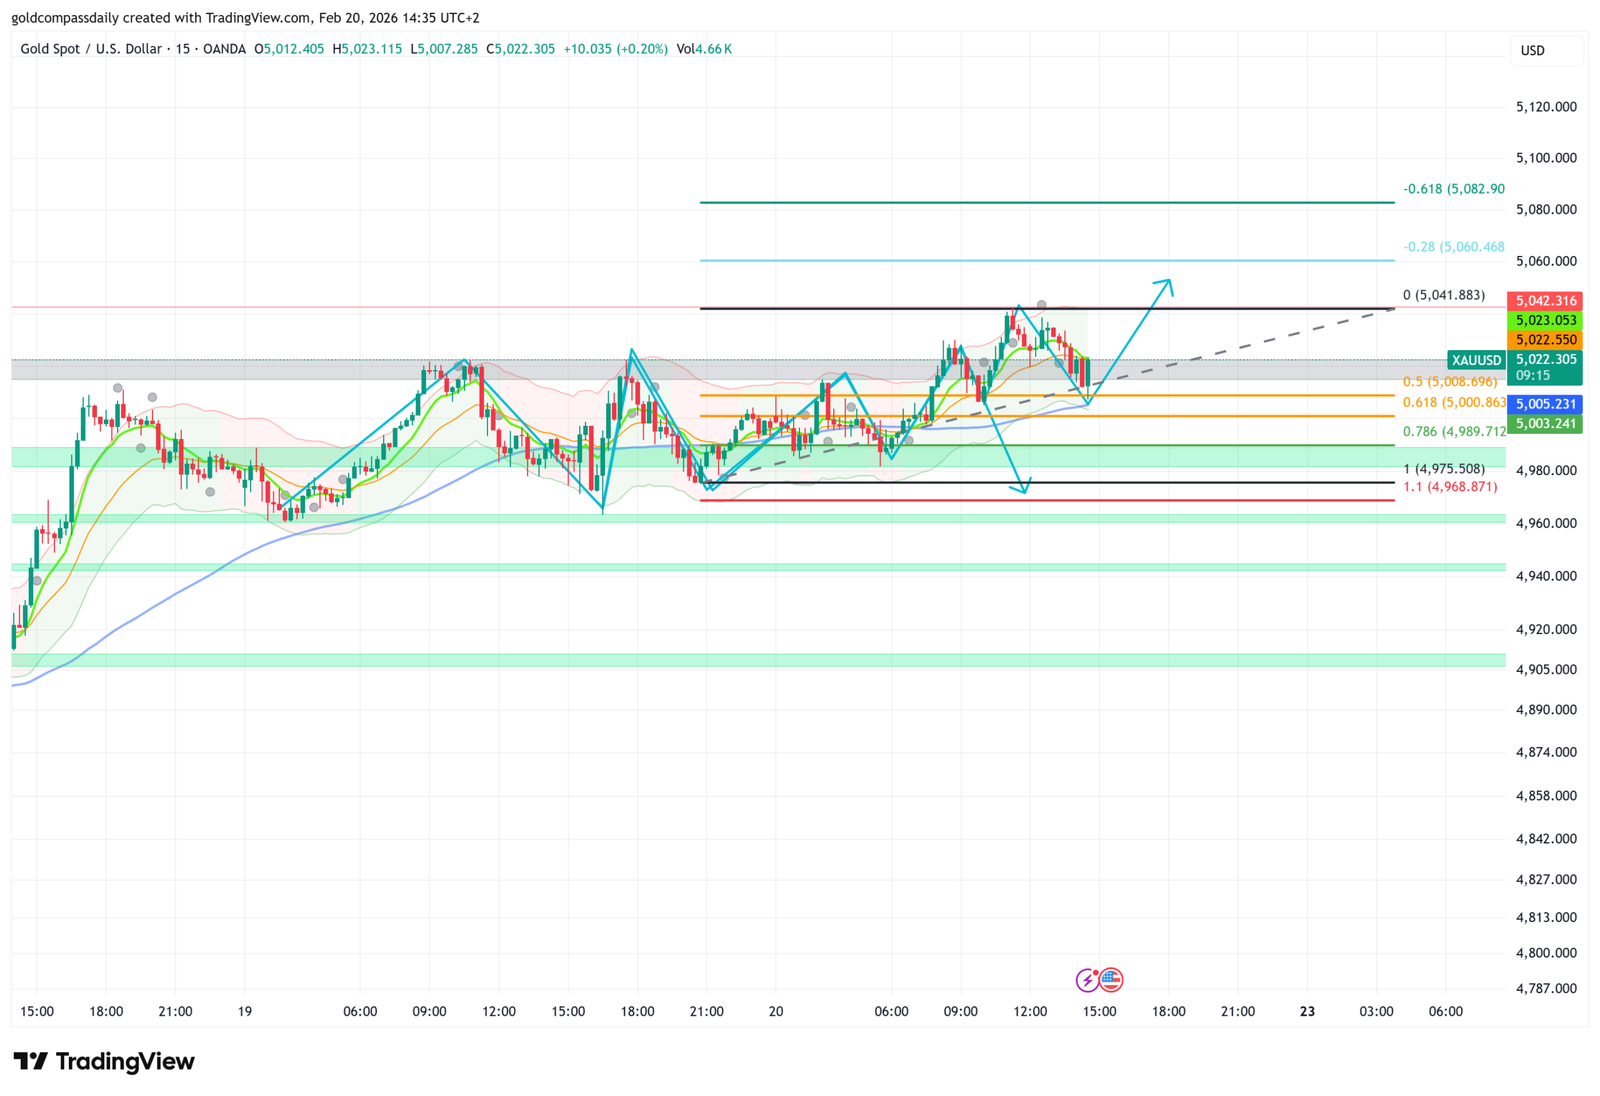
The 0.5 Fibonacci level, situated at $4,999.94 (measured from the January high of $5,597.89 to the February low of $4,401.99), is currently acting as a critical magnetic pivot. By holding above this $5,000 threshold, Gold has effectively neutralized the immediate bearish pressure from earlier in the week. This reaction confirms that the current phase is a healthy technical consolidation rather than a trend reversal.
- Buy-Side Liquidity: Consistent price rejection at the $4,990–$5,000 zone suggests strong institutional demand at these levels ahead of key US economic data.
- Moving Average Confluence: The price is currently oscillating around the 21-day SMA ($5,006), further reinforcing the importance of the $5,000 handle as the new market baseline.
Forward Outlook: Targeting the 0.618 Extension
With the 0.5 Fibonacci level successfully established as support, technical analysts are now looking toward the upper resistance boundaries. A sustained breakout from the current consolidation channel is expected to target the 0.618 Fibonacci retracement at $5,141.05. A daily close above this “Golden Ratio” would likely trigger an aggressive rally toward $5,300 and potentially the previous all-time highs.
- Upside Trigger: A clean break above the $5,045 local high will confirm the end of the corrective phase.
- Downside Risk: Failure to sustain the 0.5 support could lead to a deeper re-test of the 50-day SMA near $4,703.
Technical Support & Resistance Matrix
| Strategic Level | Price Point | Technical Significance |
|---|---|---|
| Upper Target (0.618 Fibo) | $5,141.05 | Trend Continuation Milestone |
| Dynamic Resistance | $5,006.49 | 21-Day Simple Moving Average |
| Major Support (0.5 Fibo) | $4,999.94 | Psychological & Structural Floor |
| Critical Floor | $4,703.94 | 50-Day Simple Moving Average |
Disclaimer: This analysis is based on real-time Fibonacci measurements and technical indicators. Trading gold involves significant risk due to high market volatility. Always perform independent due diligence before executing trades.

Written by T. S. Gospodinov
T. S. Gospodinov is an Independent gold market analyst focused on liquidity structures and macro-driven price cycles.


