
As of February 20, 2026, Gold (XAU/USD) is exhibiting a classic consolidation pattern, trading within a well-defined horizontal channel centered around the $5,000 psychological handle. After the historic volatility seen earlier in the month, the market has entered a phase of “price discovery,” where bulls and bears are battling for control at this critical mid-point.
The Fibonacci Anchor: Testing the 50% Retracement
The current range is technically reinforced by the 50% Fibonacci retracement level at $4,999.94, measured from the January peak of $5,597.89 to the February swing low of $4,401.99. This level is acting as a magnetic pivot point; price action tends to gravitate back to this zone, confirming it as the primary area of current market equilibrium.
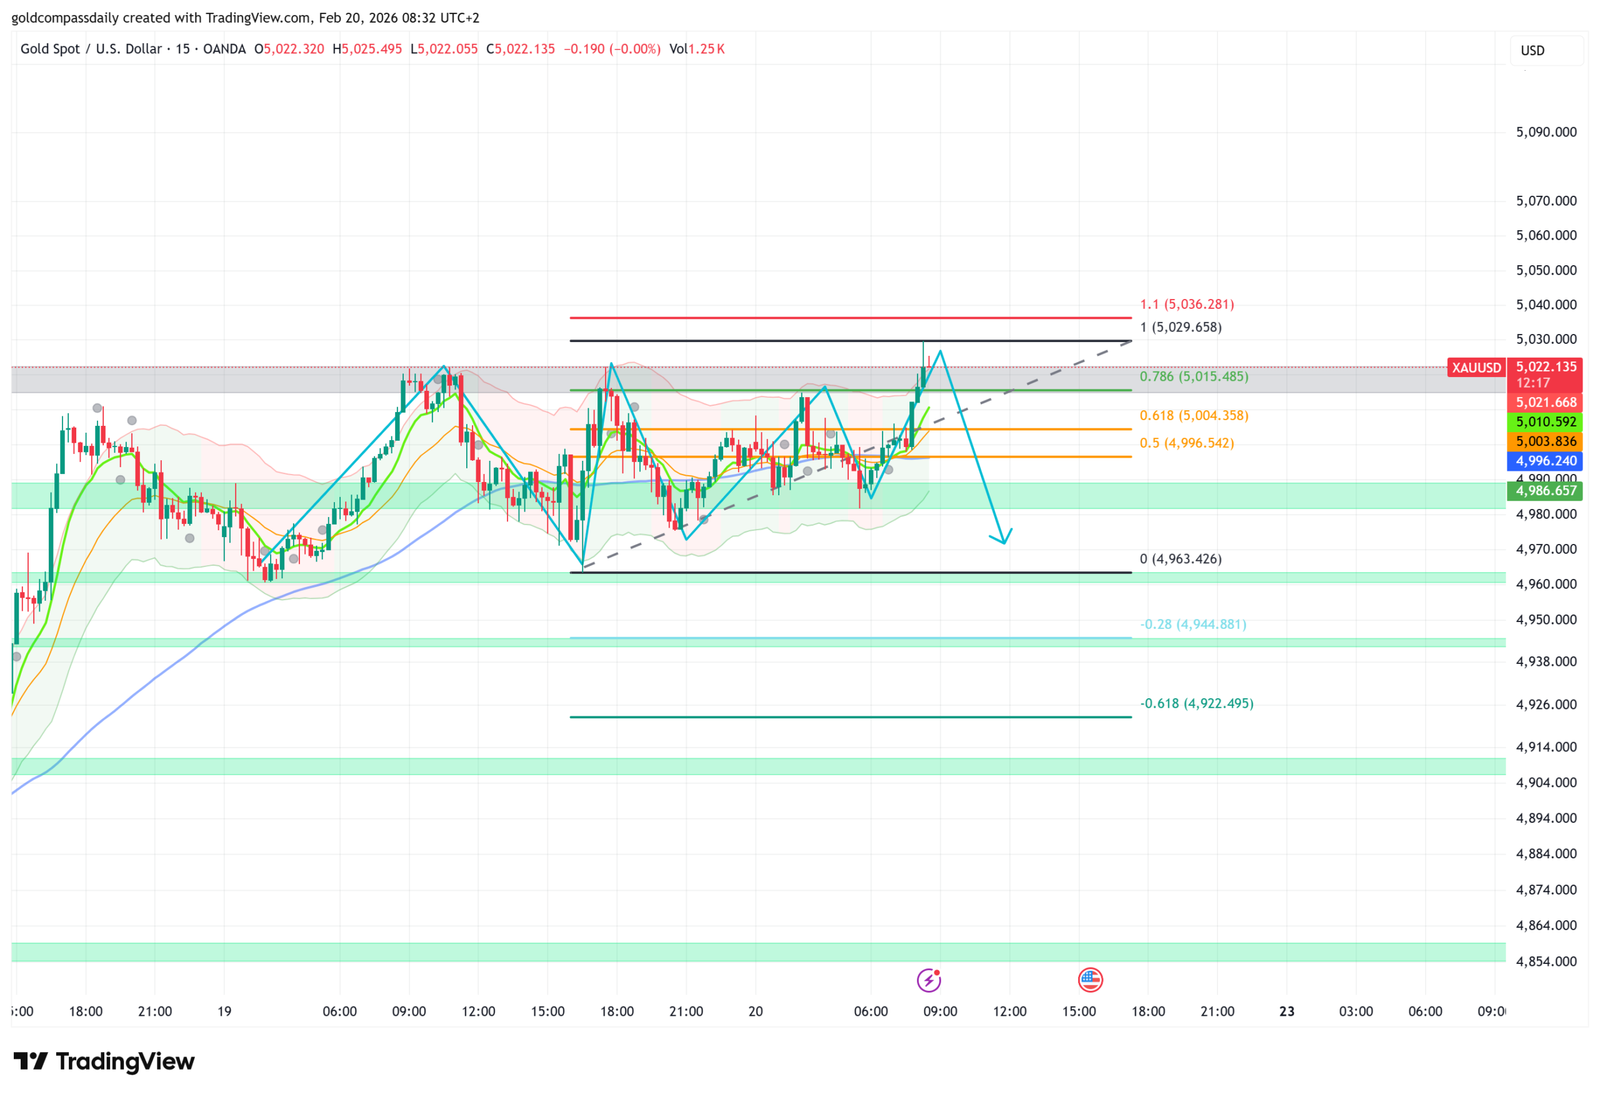
- Channel Resistance: The immediate ceiling is formed by the 21-day Simple Moving Average (SMA) near $5,006.49 and short-term supply at $5,020.
- Channel Support: On the downside, buyers are actively defending the $4,950 pivot, with a deeper structural floor established at $4,852.
Macro Catalyst: Waiting for High-Impact Data
The “sideways” movement is also a reflection of investor caution ahead of key US economic releases. Traders are closely monitoring the preliminary US GDP figures and the PCE Inflation Index scheduled for later today. These reports are expected to provide the necessary volatility to push Gold out of its current $4,990–$5,010 coiling zone.
- Bullish Breakout: A decisive close above the 61.8% Fibonacci level at $5,141 would signal the end of the consolidation and target $5,300.
- Bearish Correction: Conversely, a break below the 50-day SMA at $4,703 would risk a deeper reset toward the 200-day SMA near $3,915.
Technical Support & Resistance Levels
| Strategic Zone | Price Level | Significance |
|---|---|---|
| Upper Target (61.8% Fibo) | $5,141 | Major Trend Inflexion |
| Current Pivot (50% Fibo) | $4,999 | Central Equilibrium |
| Dynamic Support (21 SMA) | $5,006 | Immediate Resistance |
| Must-Hold Floor | $4,950 | Critical Intraday Support |
Disclaimer: This intraday report is based on current technical chart patterns and Fibonacci measurements. Trading XAU/USD carries high risk due to extreme volatility. Always utilize proper stop-loss orders around high-impact economic news releases.

Written by T. S. Gospodinov
T. S. Gospodinov is an Independent gold market analyst focused on liquidity structures and macro-driven price cycles.


