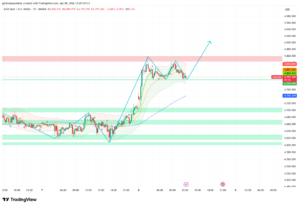
Gold (XAU/USD) enters the last week of February 2026 with a powerful bullish bias. After closing comfortably above $5,100 last Friday—marking its highest-ever weekly close—the metal has extended its rally for the fourth consecutive session. The current market structure suggests that the recent “dip and rip” cycle has provided the necessary liquidity for a sustained move toward new record territory.
Fundamental Drivers: Tariffs and the Safe-Haven Rush
The primary fuel for this week’s surge is the heightened trade uncertainty following the U.S. Supreme Court ruling on tariffs, which has revitalized safe-haven demand. Coupled with a broadly weaker U.S. Dollar and shifting Federal Reserve rate cut bets (now pricing in three cuts for 2026), the non-yielding commodity has found an ideal environment for appreciation.
Technical Roadmap: Key Fibonacci & Structural Levels
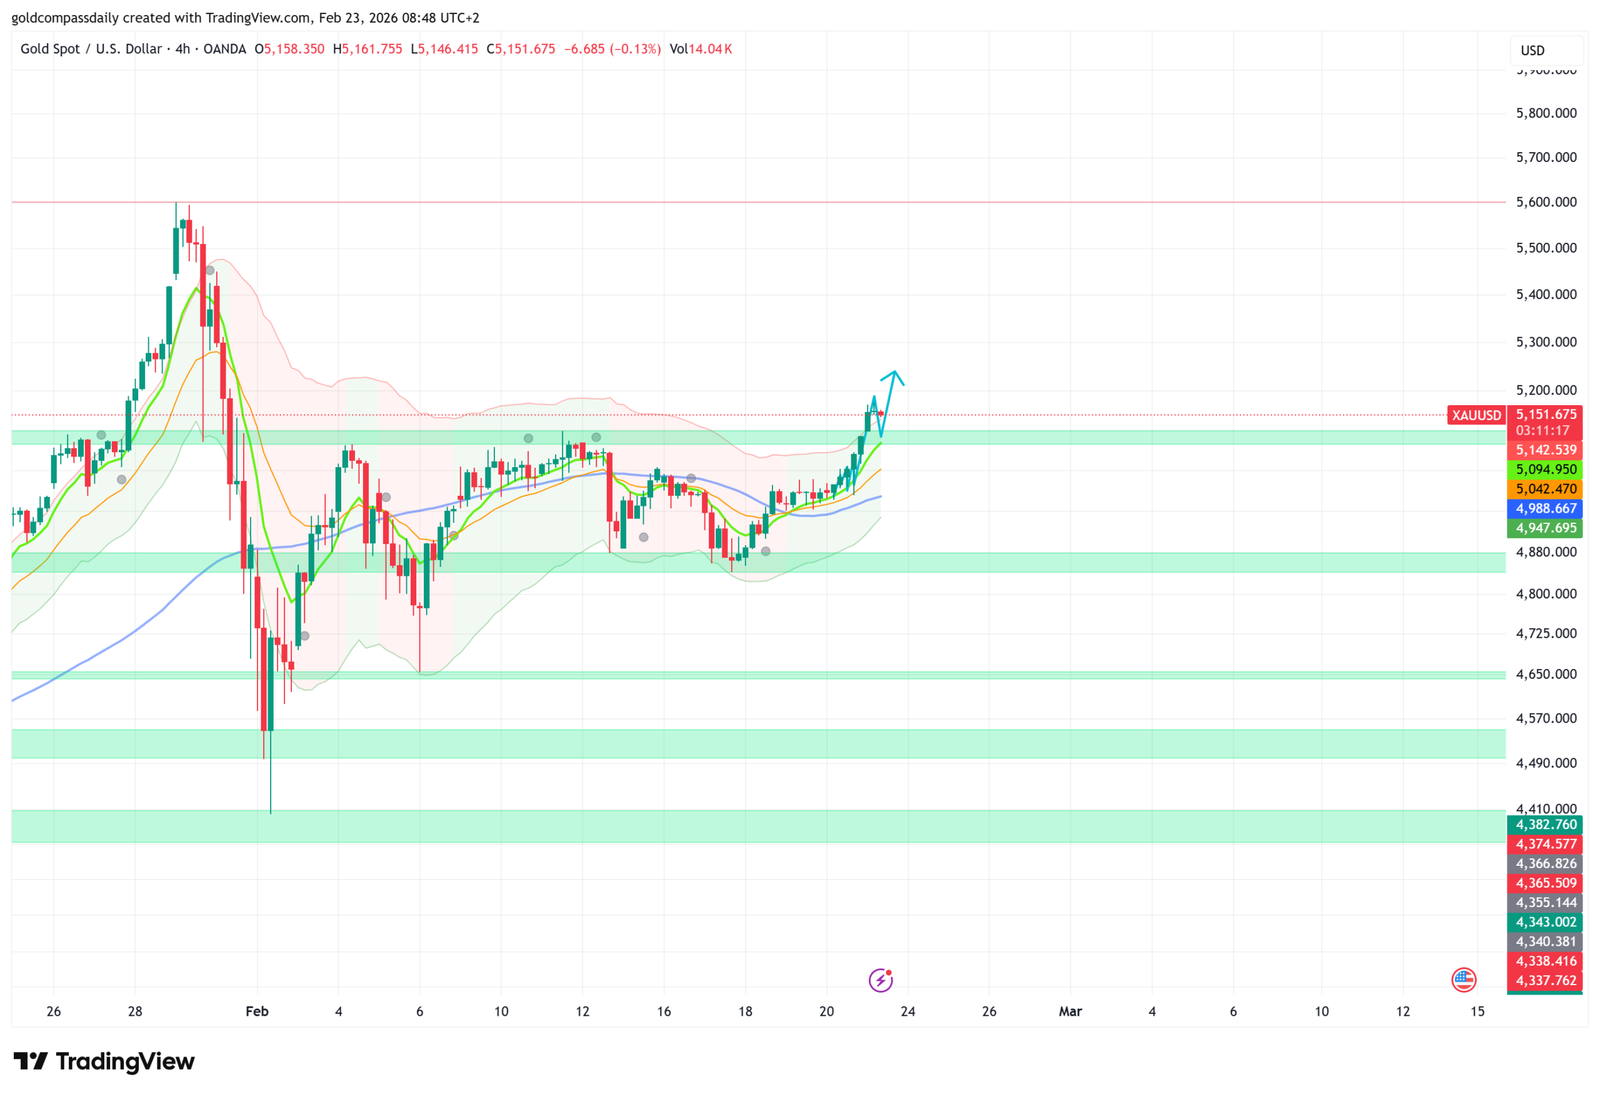
The weekly chart reveals a bullish hammer-like candle, confirming that buyers are absorbing sell-side pressure efficiently. We are now monitoring the following zones:
- Resistance Target 1 ($5,290): This represents a former intraday support zone that collapsed in late January and is now the primary upside magnet.
- The “Golden Ratio” ($5,342): The 78.6% Fibonacci retracement level sits here, aligning with major technical interest for a mid-week extension.
- Critical Support ($5,100): This horizontal resistance has been successfully flipped into support; pullbacks toward this zone are currently being treated as buying opportunities.
Weekly Projection: Structured Trend Progression
Unlike the parabolic spikes seen in January, the current advance is characterized by measured waves and controlled pullbacks. While the RSI (currently at 73) suggests overbought conditions that may lead to brief consolidation, the structural bias remains firmly upward as long as price trades above the $4,982 – $5,000 “line in the sand”.
| Strategic Milestone | Price Level | Outlook |
|---|---|---|
| Major Upside Target | $5,290 – $5,342 | Primary objective for the current leg |
| Immediate Pivot | $5,170 | Recent local peak / Resistance |
| Structural Floor | $5,080 – $5,100 | Critical buy-side liquidity zone |
| Trend Invalidation | Below $4,982 | Break of short-term bullish bias |
Disclaimer: This weekly analysis is based on technical indicators and current geopolitical drivers. Trading precious metals involves significant volatility. Always employ strict risk management.

Written by T. S. Gospodinov
T. S. Gospodinov is an Independent gold market analyst focused on liquidity structures and macro-driven price cycles.