
As we close the weekly session, the S&P 500 technical outlook suggests a market at a major crossroads. The 4-hour (4H) chart reveals a complex battle between institutional sellers and dip-buyers, centered around critical moving averages and psychological support zones. For traders looking to navigate the upcoming week, understanding these structural shifts is paramount.
SPX 4H Structure: The Battle for Equilibrium
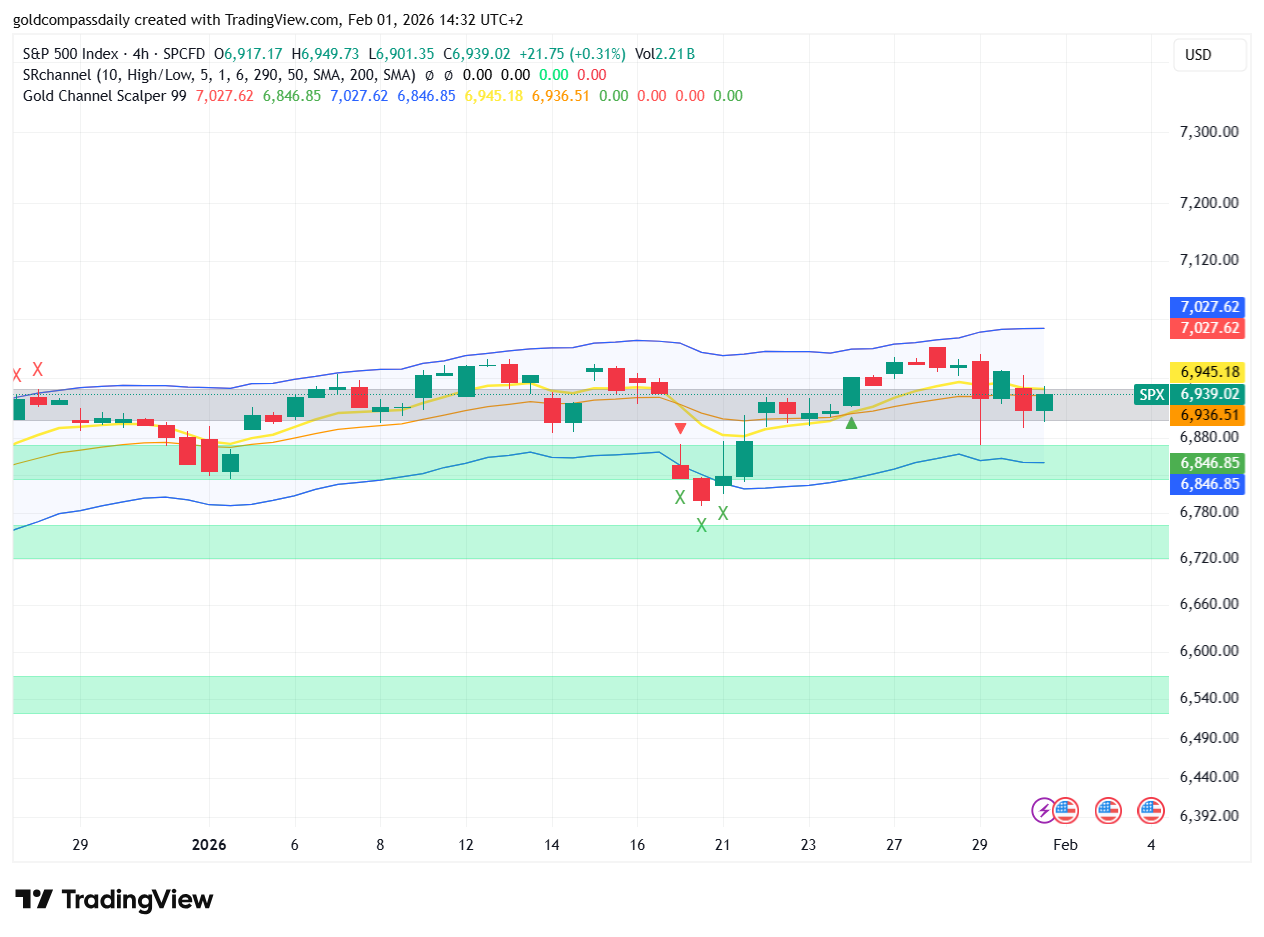
Looking at the recent price action on the 4H timeframe, the S&P 500 technical outlook shows that the index is currently trading within a well-defined consolidation range. After a period of volatility, the SPX has found a temporary floor near the 6,850 level. This area has acted as a significant “buy zone” in the past, and its ability to hold during recent sell-offs is a positive sign for the bulls.
However, the upside remains capped. Every attempt to rally towards the 7,000 psychological barrier has been met with aggressive selling pressure. This tells us that while the immediate downside is protected, the “Smart Money” is not yet ready to commit to a full-scale breakout without further confirmation from macroeconomic data.
Moving Averages and Trend Indicators
A key component of our S&P 500 technical outlook is the interaction with the 200-period Simple Moving Average (SMA) on the 4H chart. Currently, the price is oscillating around this mean, indicating a lack of clear directional momentum. When the price sits on the 200 SMA like this, it often precedes a “volatility expansion” move.
The Golden Compass proprietary scalper and channel indicators suggest that the index is currently in a “squeeze” phase. The narrowing of the Bollinger-style bands on the 4H chart typically suggests that a massive move—potentially 100-150 points—is brewing. Traders should watch for a decisive candle close above 6,950 or below 6,840 to confirm the next impulsive leg.
Support and Resistance: The Line in the Sand
In this S&P 500 technical outlook, we identify the following technical levels as the “Lines in the Sand” for the coming week:
- Primary Support (6,846 – 6,850): This is the confluence of previous swing lows and the lower boundary of our value area. A daily close below this zone would likely open the trapdoor toward 6,780.
- Intermediate Resistance (6,945): The current yellow midline on our 4H chart. Reclaiming this level is essential for any bullish continuation.
- Major Resistance (7,027): The previous local top. Breaking this level would invalidate the bearish divergence and signal a move toward new all-time highs.
Market Sentiment and Volatility Context
We cannot discuss the S&P 500 technical outlook without mentioning the VIX. With the fear gauge sitting near 17.44, the market is pricing in a moderate level of anxiety. Historically, when the SPX consolidates while the VIX remains elevated, the eventual breakout tends to be violent.
The tech-heavy Nasdaq has been leading the downside, which often serves as a leading indicator for the SPX. If technology stocks continue to see rotation out of growth into value, the S&P 500 might struggle to break its 7,000 resistance even if the broader economy remains stable.
Strategic Summary: How to Trade the SPX This Week
Concluding our S&P 500 technical outlook, the 4H chart demands patience. The current “No Man’s Land” between 6,850 and 6,950 is a high-risk zone for swing traders due to the high probability of “whipsaw” movements.
Our Golden Compass Daily Blueprints will be focusing on lower-timeframe (5m and 15m) entries until a structural breakout occurs on the 4H chart. Look for “liquidity grabs” below the 6,846 level for potential long reversals, or failed breakouts above 6,950 for short scalp opportunities.
Remember, in a sideways market, the one who waits for the breakout usually wins, while the one who tries to predict it often gets trapped. Stay disciplined, watch the moving averages, and keep an eye on the opening bell in London and New York for early clues on volume direction.
Stay tuned for our Monday morning deep dive into the 1-hour Gold and Indices correlation analysis.

Written by T. S. Gospodinov
T. S. Gospodinov is an Independent gold market analyst focused on liquidity structures and macro-driven price cycles.


